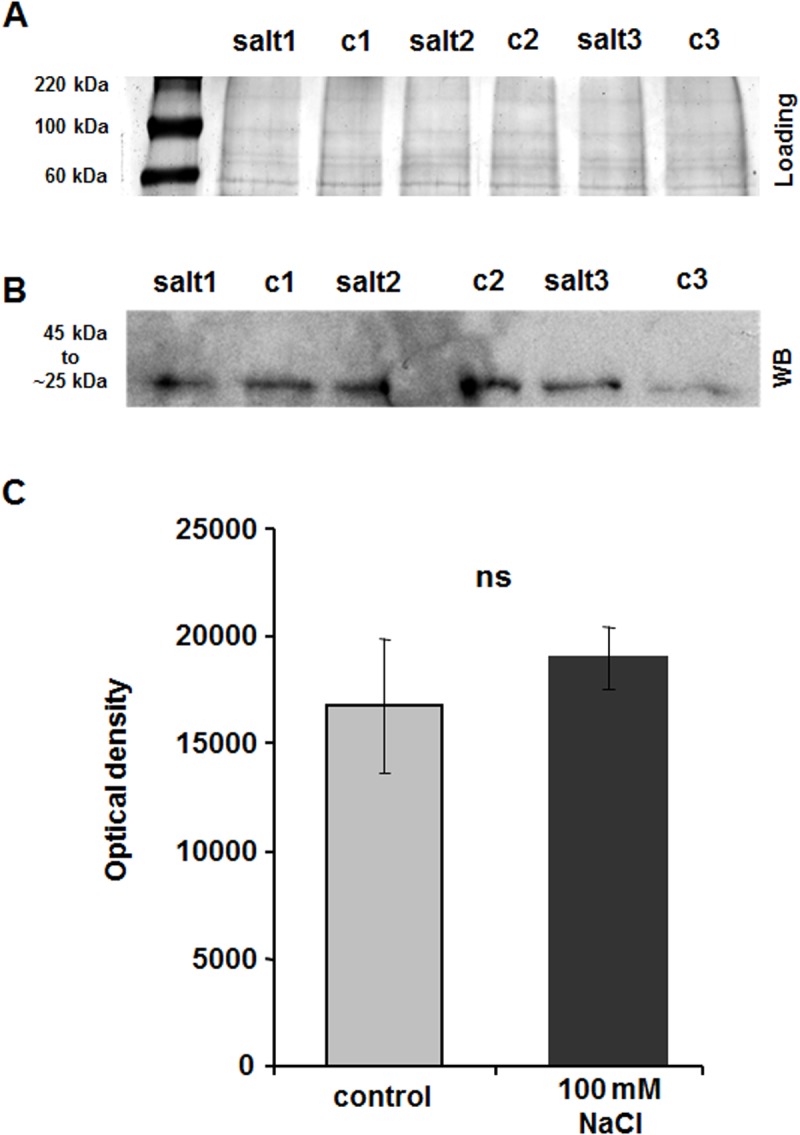
Fig 5. Western blot analysis of β-expansins in the epidermal cell wall of salt-resistant SR03.

(A) Coomassie-stained controls of the Western blot shown in (B) indicate equivalent protein levels in all lanes. c, control; salt, 8-d 100 mM NaCl treatment. Numbers 1–3 indicate biological replicates. (B) Western blot detection of β-expansins in expanding leaves of salt-treated (100 mM NaCl) and control plants. β-expansin bands appear between 45 and 25 kDa. c, control; salt, 8-d 100 mM NaCl treatment. Numbers 1–3 indicate biological replicates. (C) Densitometric analysis of Western blot bands shown in (B). Bands were plotted as the average of the optical density (OD). ns = not significant.
