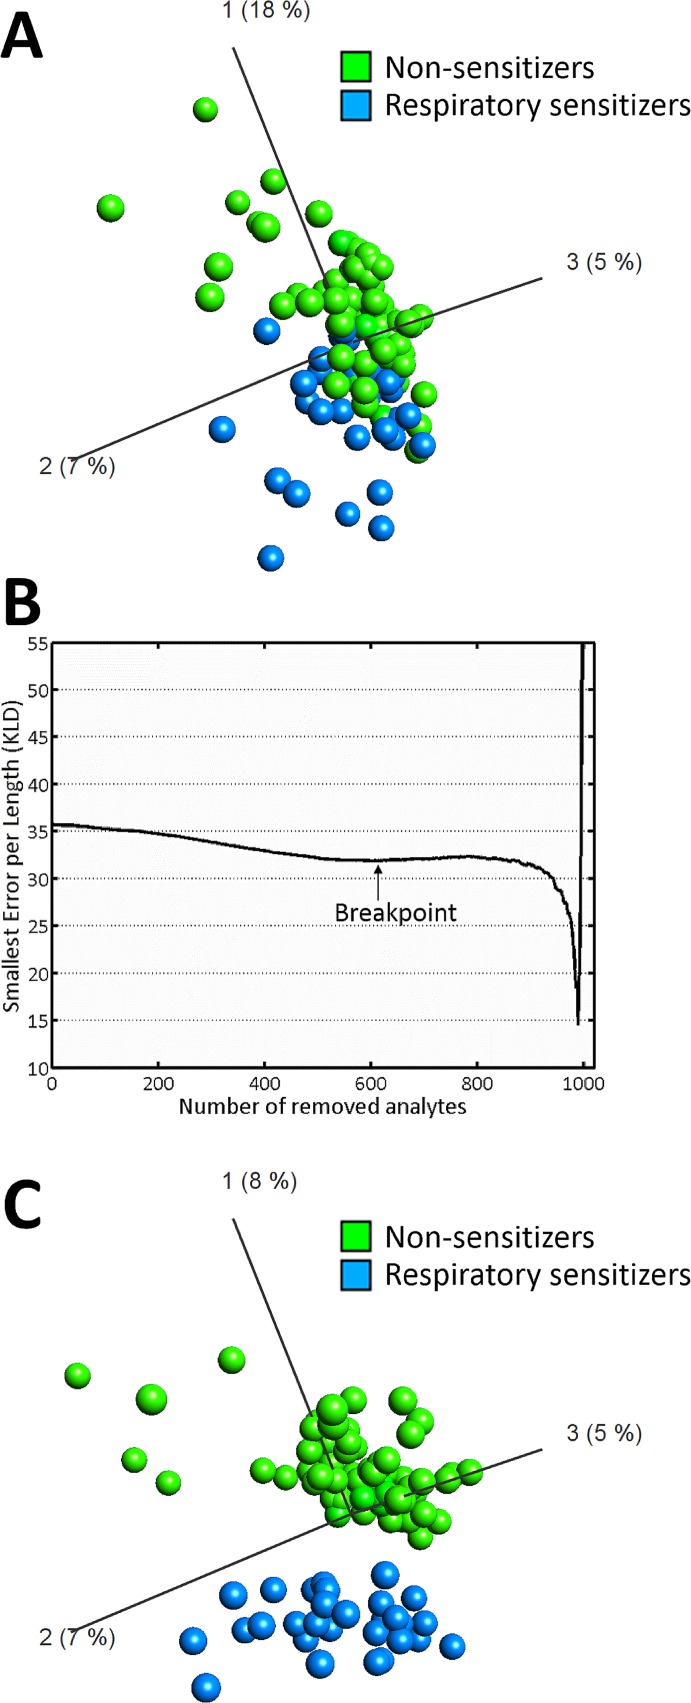
Fig 2. Establishment of a predictive biomarker signature for prediction of respiratory sensitization.
(A) Unsupervised learning was used to construct the representation of the dataset. The method was visualized using PCA based on 999 transcripts identified by one-way ANOVA p-value filtering between respiratory sensitizers (blue, n = 29) and non-respiratory sensitizers (green, n = 74). (B) The 999 transcripts identified by p-value filtering were used as input into an algorithm for backward elimination. A breakpoint in Kullback-Leibler divergence was observed after removal of 610 transcripts. (C) The remaining 389 transcripts were used as input variables into a PCA. As illustrated in the figure, a complete seperation between respiratory sensitizers and non-respiratory sensitizers was achieved in the training data.

