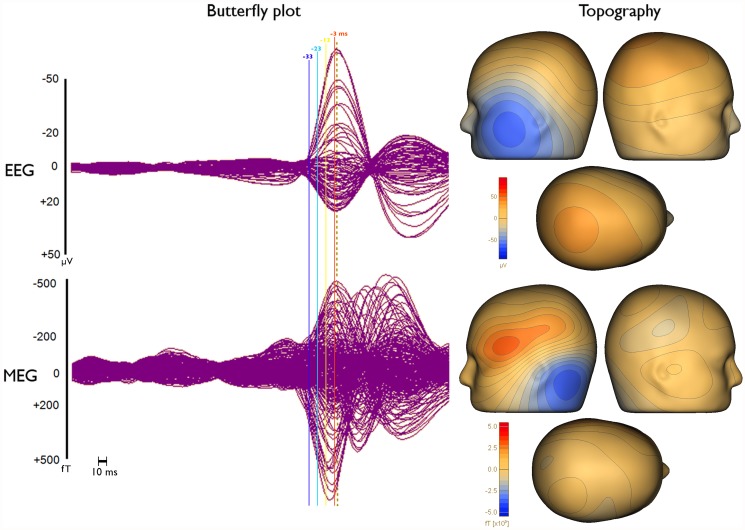
Fig 1. Butterfly plots and topographies of grand-average EEG and MEG spikes.
Butterfly plots (left) and topographies (right) of EEG (upper row) and MEG (lower row) for the grand-average (average over all 200 single epileptic spikes). The time points that are discussed in the manuscript, namely -33 ms (dark blue), -23 ms (light blue), -13 ms (yellow) and -3 ms (orange), are indicated by solid vertical lines with different colors. Topographies are shown for the EEG spike peak (time point 0 ms) as indicated by the dashed vertical line in the butterfly plots.

