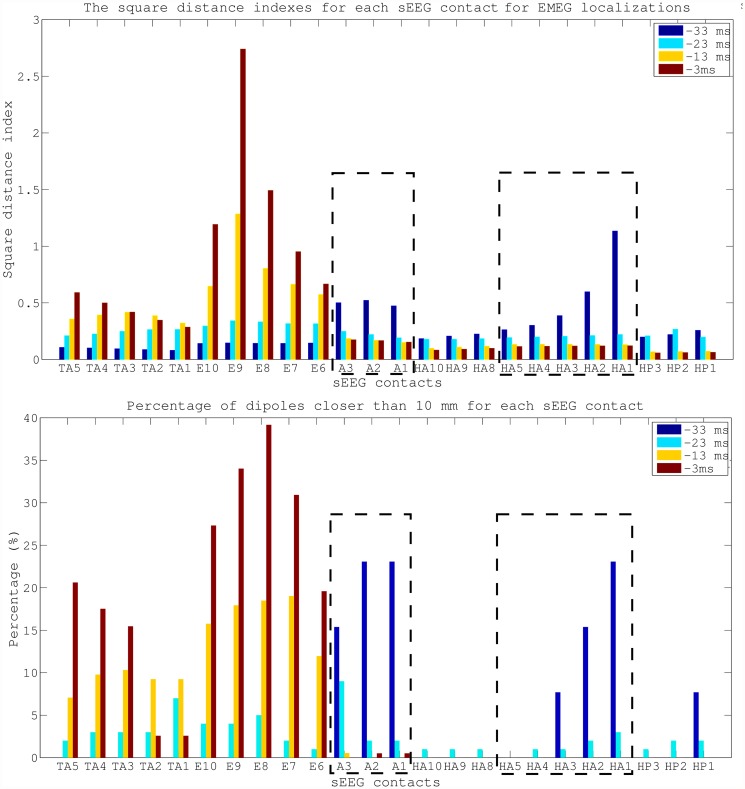
Fig 8. Quantitative comparison of EMEG source reconstructions and sEEG contacts at different propagation phases.
Square distance indexes and the percentage of dipoles closer than 10 mm for each sEEG contact. The values are given for Av10 EMEG subaverages at -33, -23, -13 and -3 ms. The sEEG contacts enclosed by dashed lines were within the seizure onset zone.

