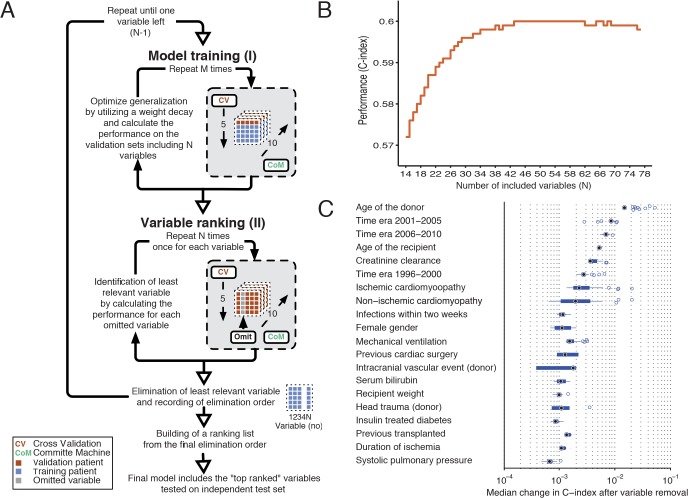
Fig 1. Schematic illustration of the variable-ranking process for the derivation cohort.
Panel (A). Step I: training of the survival model using fivefold cross-validation and a committee machine with 10 members. Step II: variable-ranking using the trained survival model from step I. Each variable is omitted from the model and the decrease in performance is recorded. The variable resulting in the least reduction in performance is removed. Steps I–II are repeated until only one variable is left. A ranking list is constructed using the elimination order. Panel (B). Performance as a function of number of variables included. The C-index is plotted against the number of input variables, where order is in terms of decreasing importance. Variables with a high index number are least important. Panel (C). The relative importance of 20 of the 43 top-ranked variables. The box plot for each variable is created from the series of C-index changes that was the result of removal of the variable during the ranking procedure.

