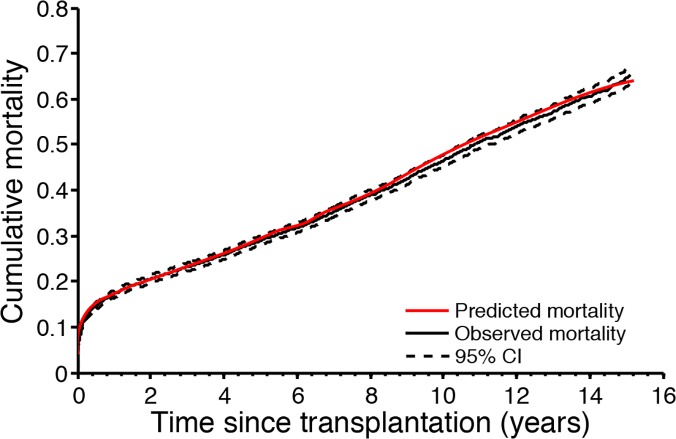
Fig 2. Cumulative mortality for the internal validation cohort (IVC).
The black solid line shows the observed cumulative mortality and dotted lines show the 95% confidence interval (estimated with Kaplan-Meier failure function) in the IVC. The red solid line shows the predicted survival for transplanted patients in the IVC.

