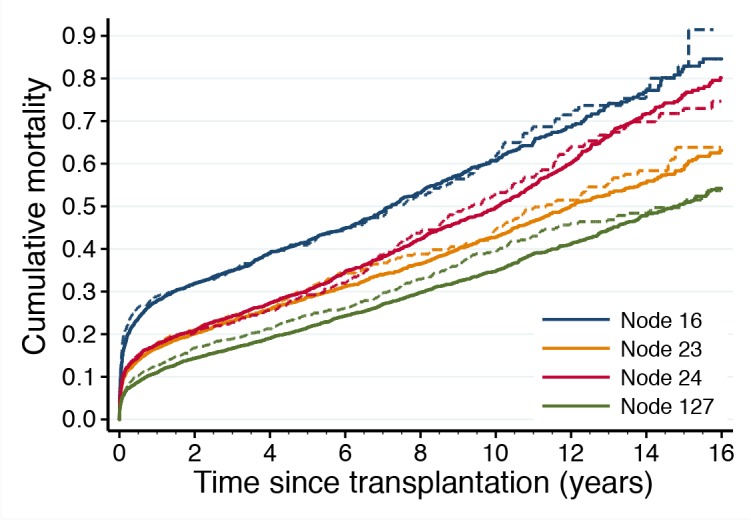
Fig 6. Validation of the IHTSA variable decision tree.

This graph illustrates the difference in observed cumulative mortality for patients belonging to leaf nodes 16, 23, 24, and 127 in the decision tree. The line color corresponds to the leaf node color in Fig. 5. The solid lines show the observed cumulative mortality for transplanted patients in the derivation cohort and dashed lines show the observed cumulative mortality for transplanted patients in the internal validation cohort (estimated with Kaplan-Meier failure function).
