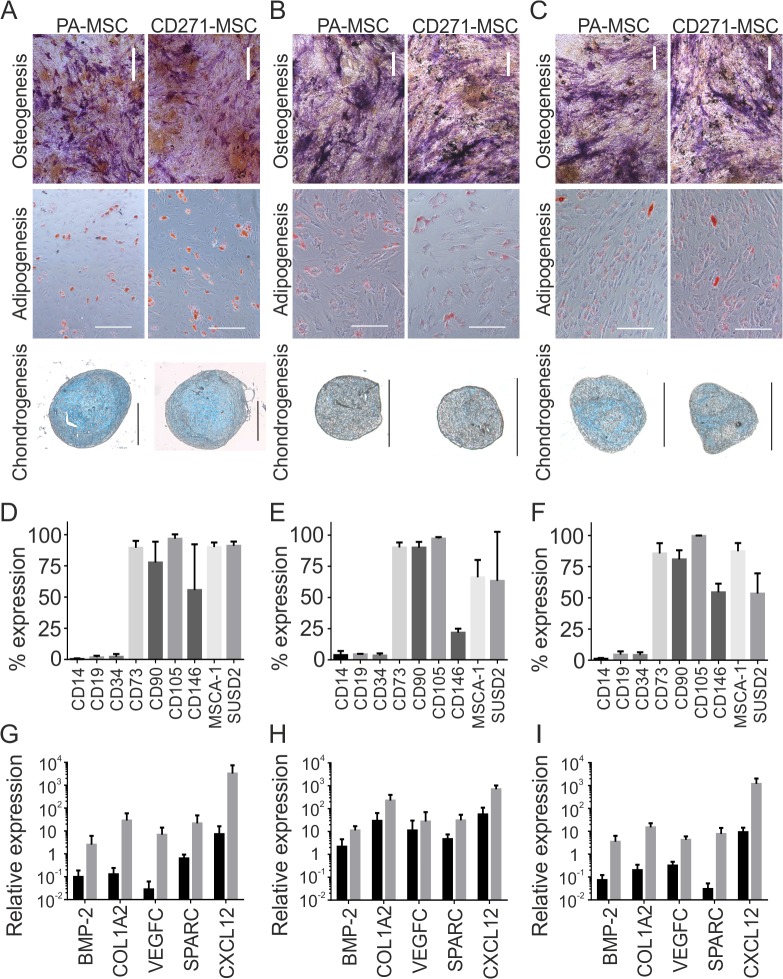
Fig 4. Functional analysis, phenotypic profile and transcripts expression of CD271 selected MSCs from BM, FH and RIA.
Differentiation potential of PA-MSCs and CD271-MSCs. Osteogenesis, adipogenesis and chondrogenesis was measured on day-21 post-induction by staining with alkaline phosphatase/von Kossa, Oil Red O and Alcian Blue, respectively in cells selected from BM (A), FH (B) and RIA (C), all size bars represent 500μm. Phenotypic analysis of the CD45−/lowCD271+ population observed in BM (D), FH (E) and RIA (F). Analysis of the total expression of BMP-2, COL1A2, VEGFC, SPARC and CXCL12 transcripts relative to HPRT in BM (G), FH (H) and RIA (I) pre (black bars) and post (grey bars) CD271 enrichment. (All data n = 3).

