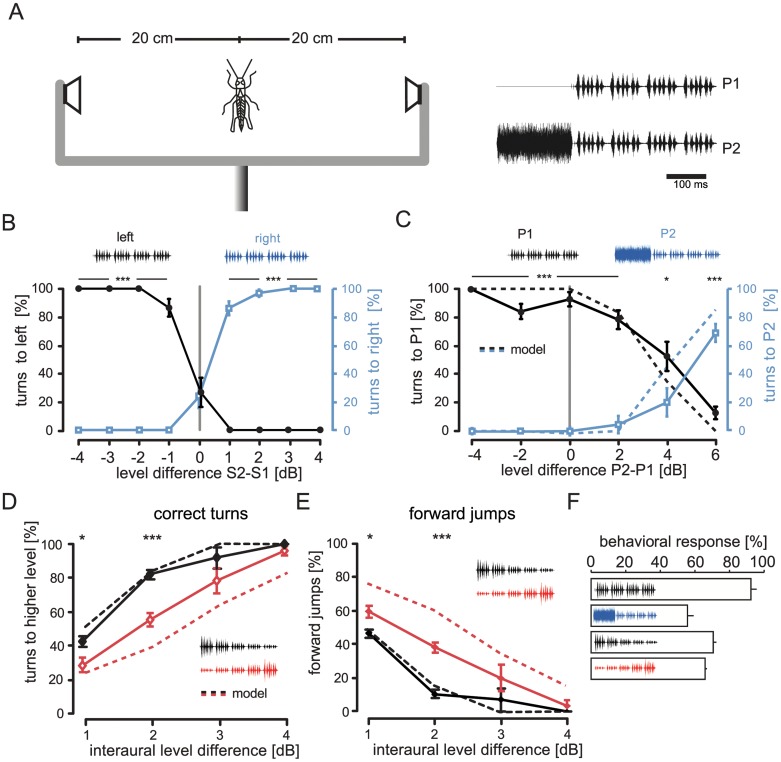
Fig 5. Behavioral tests support model predictions.
A: Arrangement of experiments with male grasshopper in the center between the two movable speakers. Right panel shows stimuli that were used in experiments presented in B and C. B: Control experiment with model song (P1 in both speakers). For the analysis, three types of behavioral responses were counted: turns to the left, turns to the right, and forward jumps. The figure contains only turns. Whenever right and left turns are short of 100%, the remaining reactions were jumps. Gray line: equal intensities at both speakers, simulating frontal stimulation. C: Same experiments as in B, but one of the speakers always had a preceding adaptor before the songs were presented (P2). Right and left stimulation was switched randomly during the experiments, plotted in reference to the adaptor stimulus. Dotted line: response of the model. D and E: Behavioral responses to ramped up (black) or down (red) songs. D: Percentage of turns towards louder side (right or left, switched randomly). Asterisks mark significance in a Wilcoxon’s matched pairs signed rank test; * p = 0.05, *** p = 0.001; E Percentage of forward jumps as a function of inter-aural level difference. Error bars show SEM. F: Overall responsiveness of the males to the four different sets of stimuli presented in B–E: control (B), forward masking (C), ramped down (D and E), and ramped up (D and E). See S3 Data for behavioral data underlying panels A-C and S2 Code for the network model.

