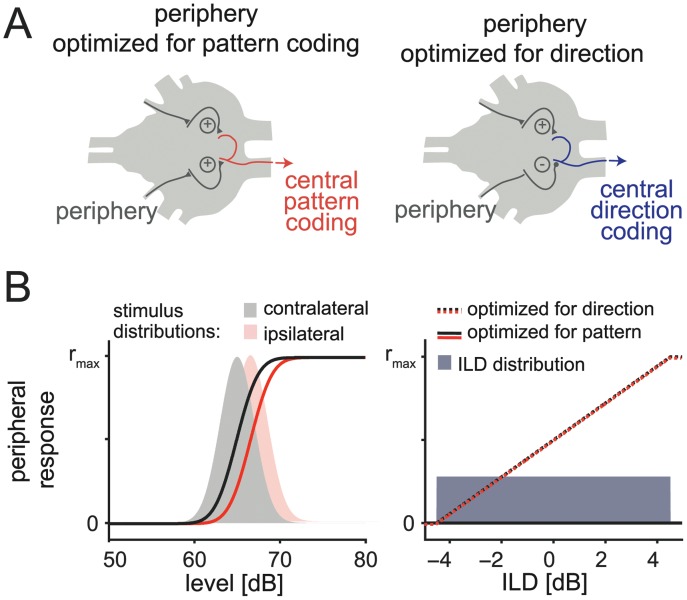
Fig 6. Conflicting demands of localization and pattern representation on peripheral adaptation.
A: Schematic drawing of the network architecture. Receptors and local neurons (gray) are subsumed under “periphery” (for more details, see Fig. 1). B: Optimal peripheral response curve for coding of pattern (left) or direction (ILD, right) of a sound. The shaded areas in the left panel represent the amplitude distributions at the ipsi-lateral (gray) and the contralateral (red) side of the animal for lateralized sound. The solid lines represent the optimal response curves of the output of the ipsi- and contra-lateral peripheral network for pattern coding. Different levels or directions demand different peripheral response curves. The shaded area in the right panel represents the distribution of all ILD the animal may experience, restricted by the physical constraints of the ears. Dashed line represents optimal outputs of the periphery for direction coding.

