
Fig 5. Results from bifurcation analysis of the system with negative feedback from ULK1 to AMPK.
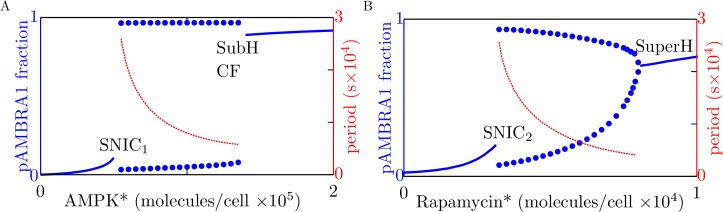
The solid blue curves indicate stable steady-state levels of AMBRA1 phosphorylation for (A) different levels of AMPK* and (B) different levels of rapamycin*. The dotted curves indicate lower and upper bounds of stable limit cycles. The red curves indicate periods of oscillation (see right vertical axes). In the left panel, the level of rapamycin* is held fixed at zero. In the right panel, the level of AMPK* is held fixed at 30,000 copies per cell. For both panels, the parameters considered in Table 1 are held fixed at their nominal values. The labels SNIC1 and SNIC2 indicate saddle-node-on-invariant-circle bifurcation points, and the label SuperH indicates a supercritical Hopf bifurcation point. The labels SubH and CF refer to subcritical Hopf and cyclic fold bifurcation points, which are very close to each other (panel A).