
Fig 8. Parameter sensitivity analysis.
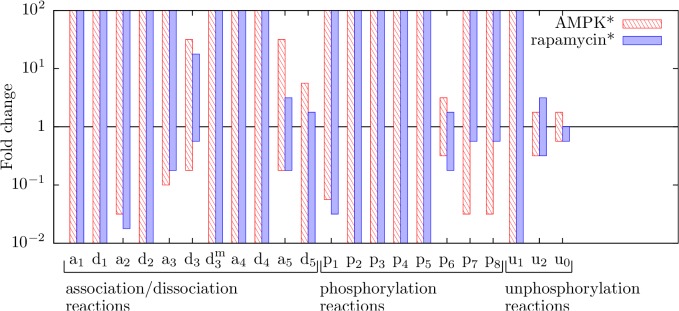
Each bar corresponds to a rate constant in the model and indicates a range of values for that rate constant over which the following pattern of qualitative behavior is obtained as a stress input (AMPK* or rapamycin* level) is varied: operation in a translation state at low stresses, oscillations between translation and autophagy states at intermediate stresses, and operation in an autophagy state at high stresses. For red bars, the stress input is AMPK* level; we considered levels of AMPK* from 0 to 106 copies per cell. For blue bars, the stress input is rapamycin* level; we considered levels of rapamycin* from 0 to 105 copies per cell. To find the upper and lower bounds of a bar, we varied (in discrete steps) the value of its corresponding parameter individually100-fold above and 100-fold below the parameter’s nominal value, which corresponds to 1 on the vertical axis. For each parameter value tested, scans of AMPK* and rapamycin* levels were performed to determine whether responses to varying levels of stress follow the same pattern as the system with nominal parameter values. The height of a bar serves as a measure of robustness. We considered all rate constants of the model with the exception of p 9. (Recall that the influence of p 9 on system behavior has already been considered, in Fig. 7.)