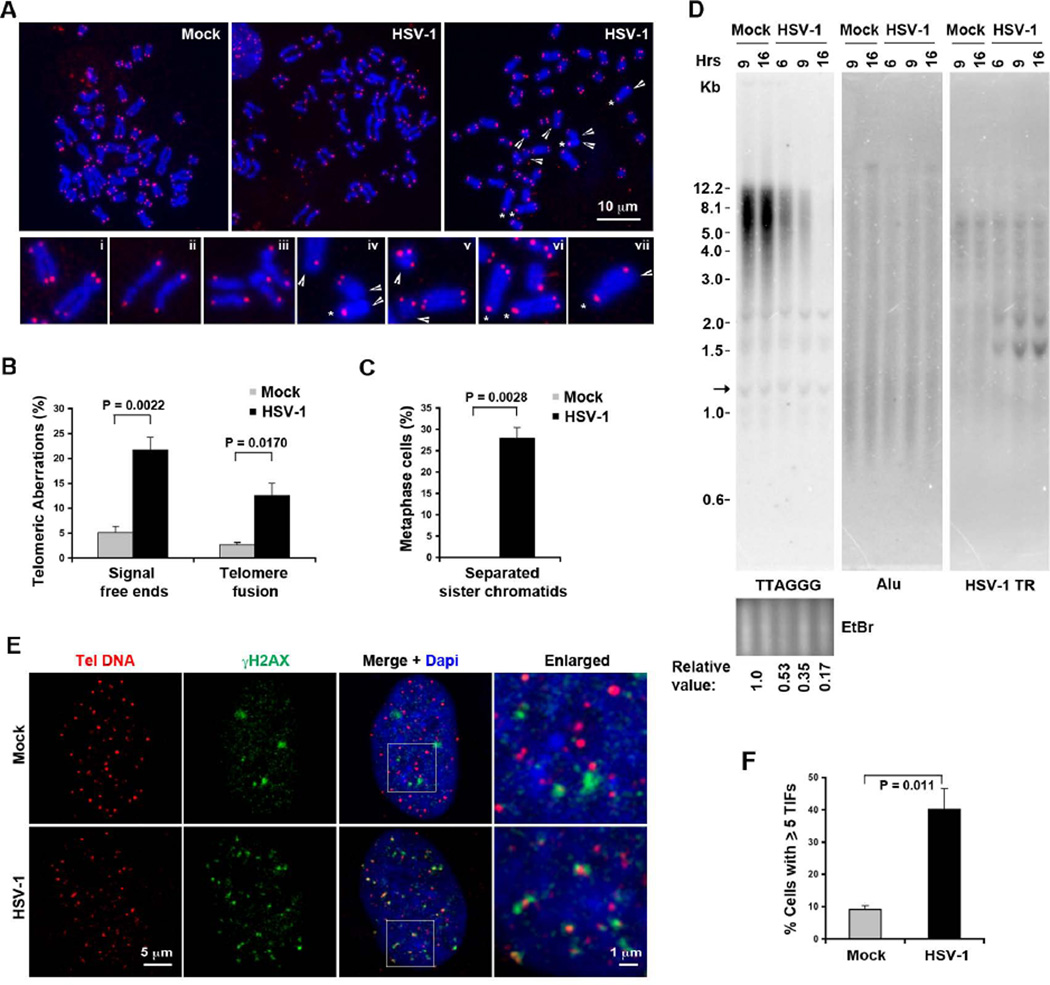
Figure 1. HSV-1 infection leads to an increase in chromosomal aberrations and TIFs.
A) Telomeric DNA FISH analysis on metaphase spreads for telomere and chromosomal defects. Infected BJ cells with separated sister chromatids are shown in the middle panel. Representative dysfunctional telomeres are indicated by arrow-head (telomere free ends), or star (sister chromatid fusions). Magnified views of aberrations are shown in panels i–xii: normal telomere ends (i), separated sister chromatids (ii–iii), telomere free ends, and sister chromatid fusions (iv–vii). B) Quantification of telomere defects for telomere free ends and chromatid fusions. Bars represent mean percentage of chromosomes with indicated telomeric aberrations (±SD) obtained from three independent HSV-1 infection and FISH experiments. The total number of counted chromosomes was about 1370 and 1104 for mock and HSV-1 infected cells, respectively. P values were obtained by two-tailed Student’s t –Test. C) Quantification of metaphase cells with separated sister chromatids. The bar graph represents average percentage of metaphase cells (n=37 or 35 for mock or HSV-1 infected cells, respectively) with separated sister chromatids (±SD) from three independent experiments. P values were calculated by two-tailed Student’s t – Test. D) BJ cells were infected with HSV-1 wt (MOI=0.1), or mock for indicated time, and telomere length assay was performed by Southern blot using 32P-labeled (TAACCC)4 probe (left), followed by hybridization with Alu probe (middle) or an oligonucleotide probe specific for HSV-1 TR region (right) under denaturing conditions. Relative telomere signals are shown at the bottom, the arrow indicates the internal band used for normalization. E) Confocal microscopy analysis of cells with TIFs. BJ fibroblasts were infected with wild-type HSV-1 or mock infected, and assayed by immuno-FISH with the CCCTAA PNA probe (red) and antibody to γH2AX (green) at 6 hrs post-infection. Enlarged images derived from the white square in DAPI (blue) and merged images are shown on the right. F) Quantification of telomere associated DNA damage foci as represented in (E). The bar graph shows the mean (±SD) derived from quantification of ~ 100 nuclei for each infection from multiple independent TIF assays (n=4). P value was calculated by a two-tailed Student’s t –Test. See also Figure S1.

