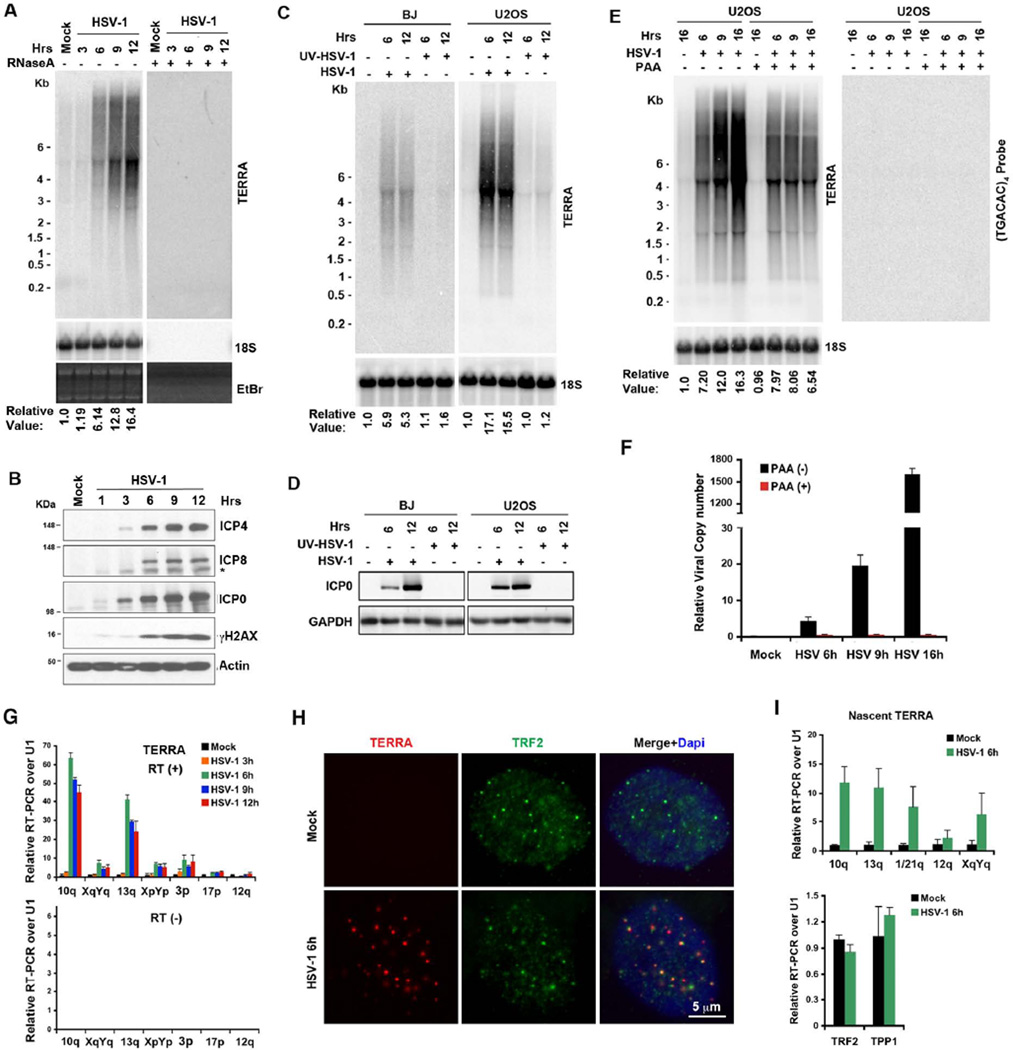
Figure 2. HSV-1 infection rapidly induces high TERRA levels.
A) Northern blot of TERRA RNA from BJ fibroblasts infected with HSV-1 (MOI=3) over the indicated time course without (−) or with (+) RNase A treatment. Ethidium bromide stained gels are shown to monitor RNA integrity. TERRA signals are shown as normalized relative to 18S rRNA signals and mock infection. B) Western blot of HSV-1 infected cells as shown in (A), using antibodies for viral proteins ICP0, ICP4, or ICP8, and cellular factors phosphorylated H2AX (γH2AX) or β-actin. C) TERRA is not induced by infection with UV-irradiated HSV-1. BJ and U2OS cells infected with wt or UV-irradiated HSV-1 for 6 or 12 hrs were assayed by Northern blot. The numbers below show the relative values for TERRA RNA normalized to 18S RNA and mock infection. D) Western blot of viral infection in infected cells, as shown in (C). Antibody specific for ICP0 was used to monitor HSV-1 infection. E) Inhibition of viral DNA synthesis partially abrogates TERRA induction. U2OS cells were infected with HSV-1 (MOI=1) in the presence or absence of PAA, and assayed by Northern blot using 32P-labeled (TAACCC)4, or (TGACAC)4 or 18S control probes. F) The effects of PAA on viral DNA synthesis were assayed by qPCR to measure viral DNA copy number. The bar graph shows the mean values (±SD) of VP16-p relative to actin region from triplicate samples by ΔCT methods. G) Quantitative RT-PCR analysis of TERRA RNA transcribed from subtelomeres over the course of HSV-1 infections in BJ cells. The bar graph shows the relative values of TERRA signals normalized to U1 snRNA and mock infection by ΔΔCT methods with (upper) or without (lower panel) reverse transcription (RT). The standard errors were derived from triplicate samples. H) BJ cells were infected with HSV-1 or mock infected, and assayed by immuno-RNA FISH for TERRA (red) and TRF2 (green) at 6 hrs post-infection. DAPI staining is shown in blue in merged panels. I) qRT-PCR analysis of nascent TERRA RNA transcribed from indicated subtelomeres in BJ cells infected with HSV-1 for 6 hrs. The bar graph shows the relative value of TERRA values (upper) or TRF2 and TPP1 mRNA (lower panel) normalized to U1 RNA and mock infection (Mean±SD). See also Figure S2.

