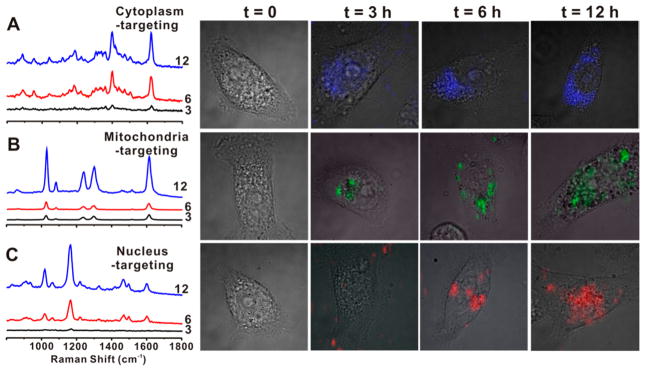
Figure 3.

Time-dependent live cell Raman images (50 × 50 pixel) after incubating with subcellular targeting NNPs. (A) Representative Raman spectra obtained from inside cells incubated with MB-coded NNPs for cytoplasm targeting, bright field image (t = 0), and bright field images overlaid with Raman images (t = 3, 6, 12 h) (4.0 mW laser power; 100 ms exposure time per pixel). (B) Representative Raman spectra from cell incubated with 44DP-coded NNPs for mitochondria targeting, bright field image (t = 0), and bright field images overlaid with Raman images (t = 3, 6, 12 h) (200 μW laser power; 10 ms exposure time per pixel). (C) Representative Raman spectra from cell incubated with AB-coded NNPs for nucleus targeting, bright field image (t = 0), and bright field images overlaid with Raman images (t = 3, 6, 12 h) (200 μW laser power; 10 ms exposure time per pixel).
