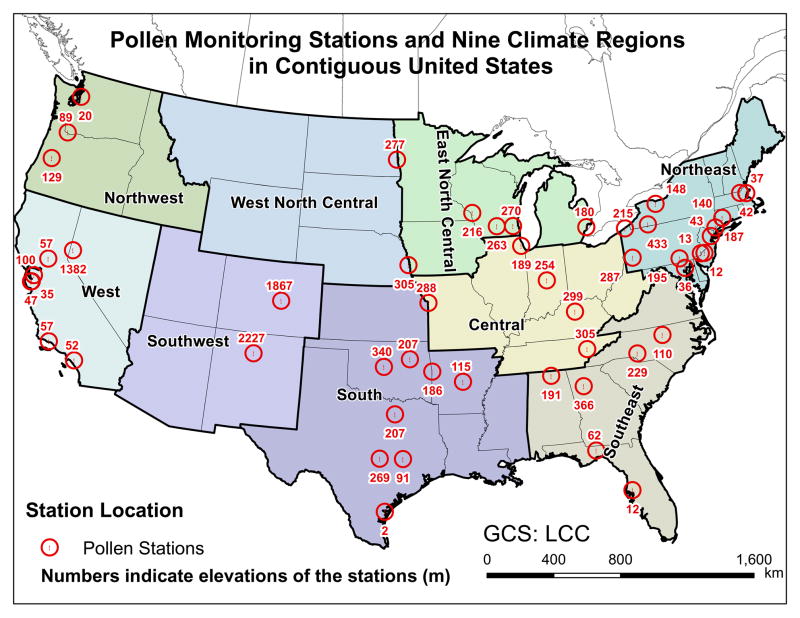
Fig. 1.
Distribution of the studied pollen stations (n = 50) across the nine climate regions in the contiguous US. The climate regions are classified according to National Climatic Data Center of the National Oceanic and Atmospheric Administration (Karl & Koss, 1984).

