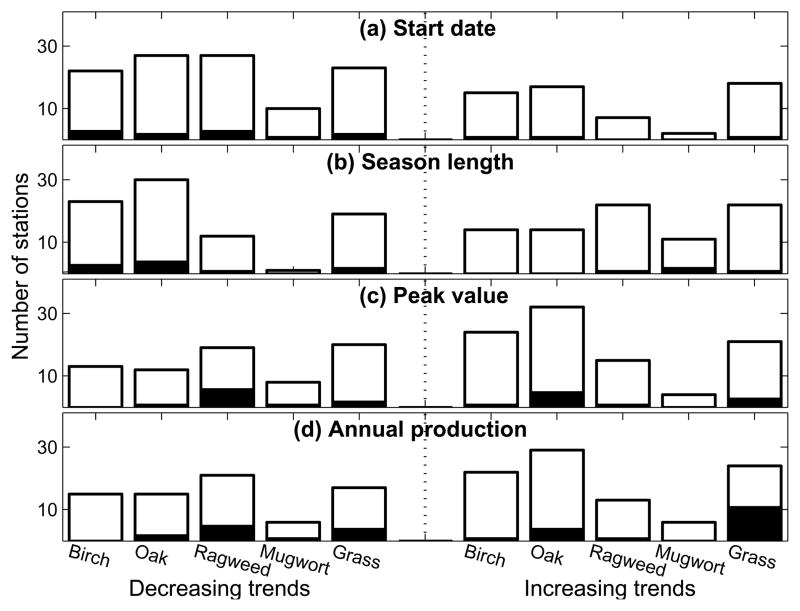
Fig. 2.
Number of stations where decreasing or increasing trends of pollen indices have been observed from 1994 to 2010. (a) Start Date, (b) Season Length, (b) Peak Value, and (d) Annual Production. The black bar indicates the number of stations at which the observed trends are significant at 5% level based on the Student’s t test. Decreasing trends indicate that pollen season tends to start earlier, season length tends to be shorter, and peak value and annual production tend to decrease.

