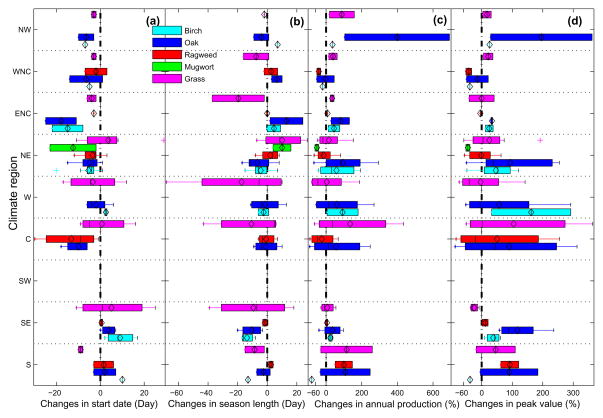
Fig. 3.
Changes in mean pollen indices during period of 2001–2010 from the means during 1994–2000 across the contiguous US. The nine climate regions: South (S), Southeast (SE), Southwest (SW), Central (C), West (W), Northeast (NE), East North Central (ENC), West North Central (WNC), and Northwest (NW). (a) Start Date, (b) Season Length, (c) Annual Production, and (d) Peak Value. In each box plot the central black line is the median; the black diamond is the mean; two sides are the 25th (q1) and 75th (q3) percentiles; the whiskers represent q3+1.5(q3−q1) and q1−1.5(q3−q1), respectively. “Outliers” were plotted as plus (‘+’). A negative number indicates earlier pollen season start date, shorter season length, and decreasing pollen levels.

