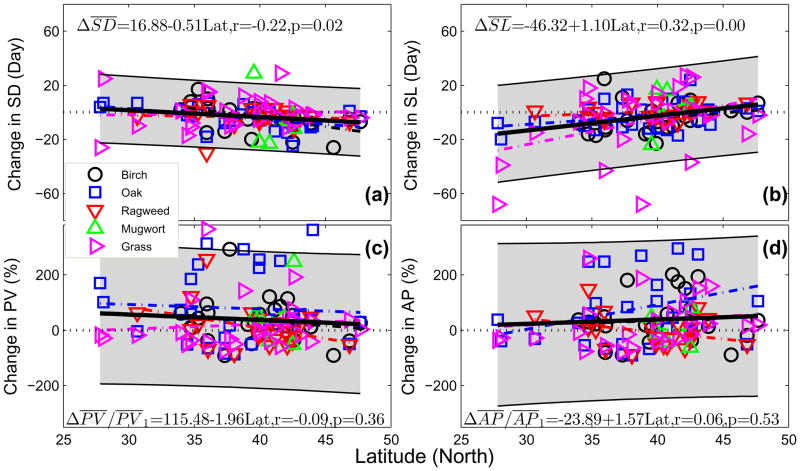
Fig. 4.
Changes in mean pollen indices between the periods of 2001–2010 and 1994–2000 as a function of latitude. (a) Start Date, (b) Season Length, (b) Peak Value, and (d) Annual Production. Heavy black lines represent the overall trends; dashed lines give trends for individual taxa; shaded gray area is the 95% CI of overall trend. Horizontal dotted lines are zero lines.

