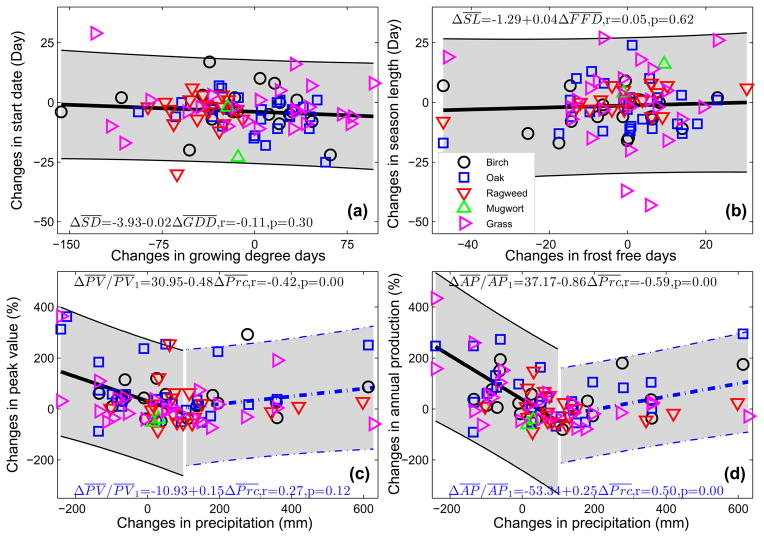
Fig. 5.
Changes in mean pollen indices and changes in mean climatic factors between periods of 2001–2010 and 1994–2000. (a) Start Date and GDD, (b) Season Length and FFD, (b) Peak Value and precipitation, and (d) Annual Production and precipitation. Heavy lines represent the trends; shaded gray areas are the 95% CIs. The initial and last dates and base temperature used to calculate GDD, FFD and accumulated precipitation are listed in Table S3. In panels (c) and (d), the trend line is divided into two stages at ΔPrc = 100 mm to show the dual effects of precipitation on airborne pollen levels.

