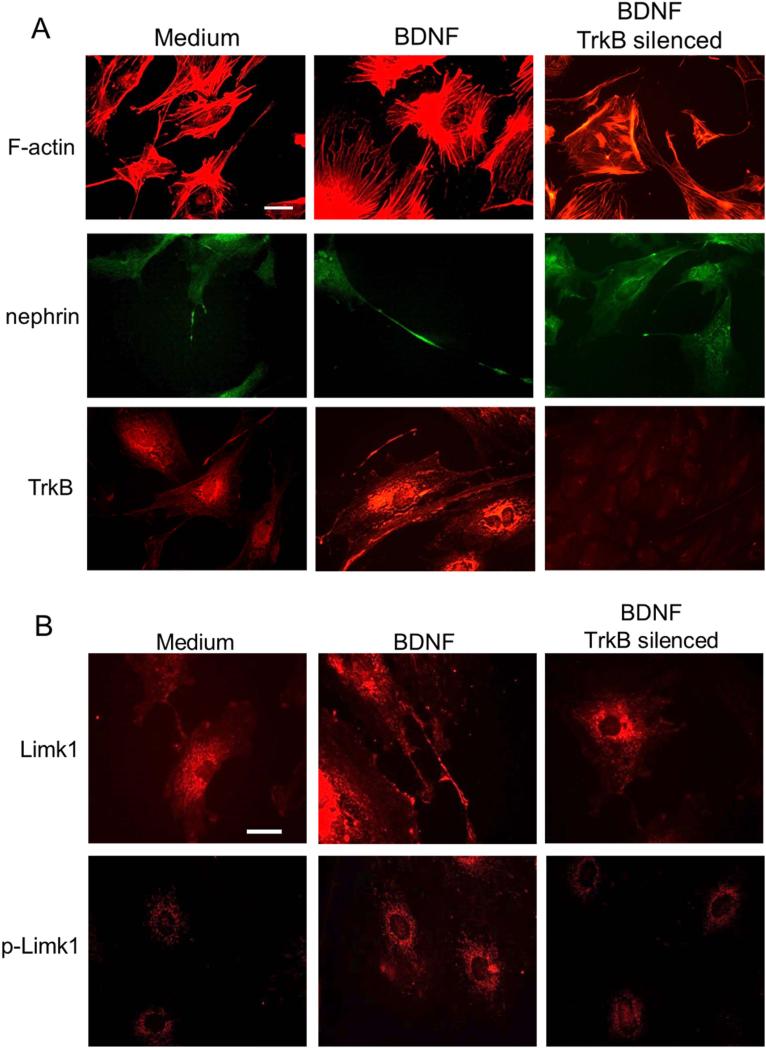
Fig 2. BDNF effects on podocyte processes.
A) Immunostaining highlights the effects of BDNF (middle column) as compared to control medium (left column). Phalloidin staining of filamentous actin (F-actin) emphasizes stress fibers and cell ramifications, which appear more developed after BDNF incubation. Nephrin positivity is evident along elongated cell processes, and TrkB expression looks increased. All changes are abolished by TrkB silencing (right column). Scale bar 20μm.
B) Limk1 and pLimk1 show increased expression after BDNF treatment (middle panels) as compared to control (left panels). BDNF effects are abolished by TrkB silencing (right panels). Scale bar 30 μm.

