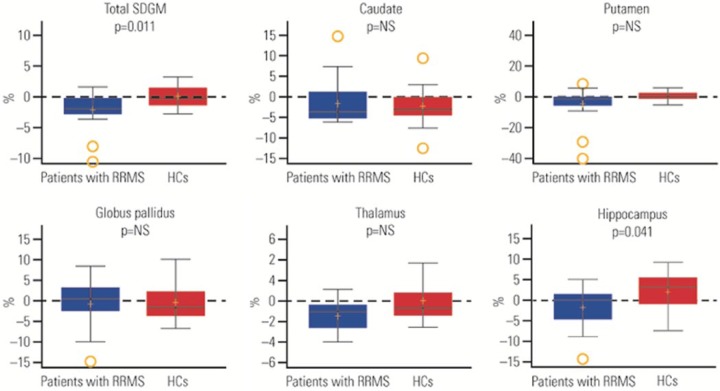
Figure 3.
Percentage change from baseline to week 24 in normalized volume of brain subcortical deep gray matter (SDGM) structural regions.
In the box plots, the yellow + represents the mean; the solid line represents the median; the dashed line represents no change; the colored boxes represent the middle 50% of data; the top and bottom of the box represent the first and third quartiles; the open circles are outliers. The ‘whisker lines’ above and below the boxes represent the largest and smallest values that are not considered to be outliers. p values shown are for the difference between relapsing–remitting multiple sclerosis (RRMS) and healthy controls (HCs) from Wilcoxon rank-sum test. NS, not significant.

