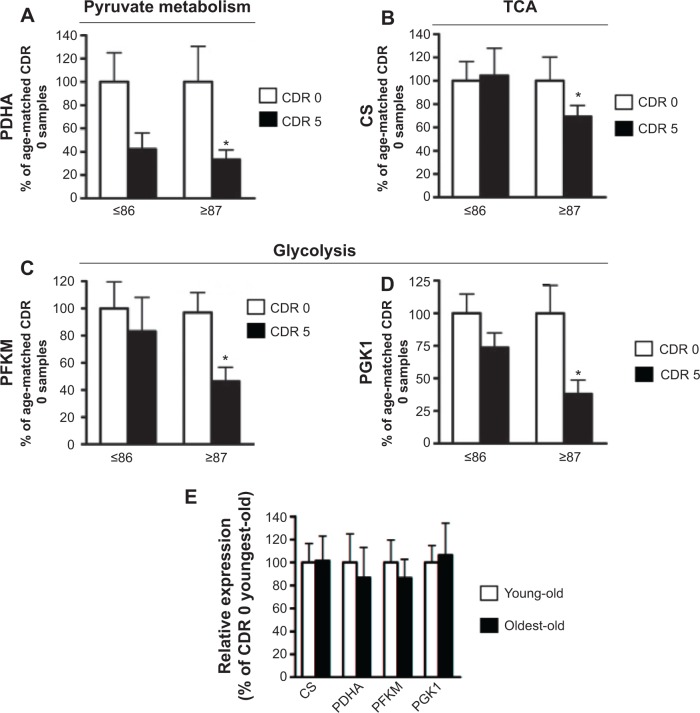
Figure 2.
Confirmatory studies of differentially expressed genes in young-old and oldest-old subjects by qPCR.
Notes: Quantitative PCR was performed to validate the microarray results. Bar graphs represent means ± SEM of gene expression levels for (A) PDHA, (B) CS, (C) PFKM, and (D) PGK1 in cognitively normal (controls, CDR 0) and AD dementia (CDR 5) young-old (YO) and oldest-old (OO) subjects. (E) No difference in the expression level of target genes was observed in CDR 0 subjects between the two age groups. Fold changes between groups were calculated using the ΔCt method. Statistical analyses by 2-tailed Student’s t-test were conducted using GraphPad Prism software (GraphPad Prism Software Inc., San Diego, CA, USA); *P-value <0.05, age-matched CDR 5 versus CDR 0 group.
Abbreviations: qPCR, quantitative PCR; PCR, polymerase chain reaction; SEM, standard error of mean; PDHA, pyruvate dehydrogenase α-1; CS, citrate synthase; PFKM, M-type phosphofructose kinase; PGK1, phosphoglycerate kinase-1; CDR, clinical dementia rating; AD, Alzheimer disease; TCA, tricarboxylic acid cycle.

