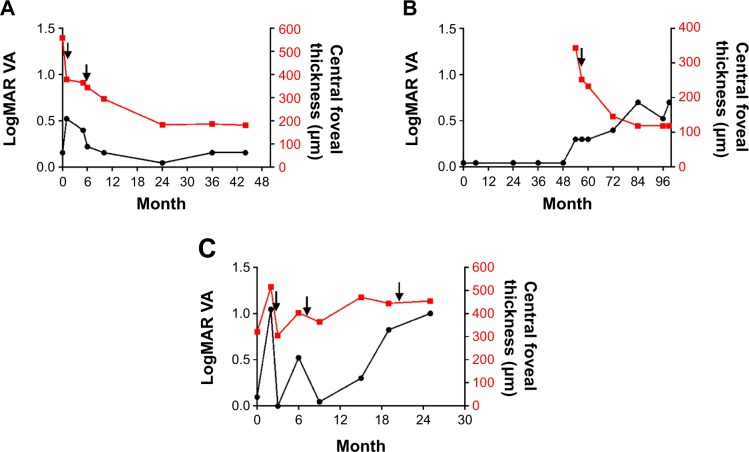
Figure 1.
Response of choroidal osteoma to intravitreal injections of bevacizumab.
Notes: The left and right vertical axes in the graph represent LogMARvisual acuity (VA) and central foveal thickness, respectively. The horizontal axis is the time course from the initial visit. (A) In case 1, VA was temporarily decreased. However, at the final follow-up, the central foveal thickness was 181 μm and LogMAR VA was 0.15. VA remained unchanged at the final visit compared with the initial visit. (B) In case 2, central foveal thickness was decreased from 343 μm to 119 μm. LogMAR VA changed from 0.04 to 0.69. There were no data on the central foveal thickness before 54 months because we introduced spectral domain optical coherence tomography in our hospital in 2009. (C) In case 3, the central foveal thickness was 454 μm at the final visit. VA temporarily improved, but LogMAR VA changed from 0.09 to 1.00. Arrows denote intravitreal injections of bevacizumab.

