
Figure 6.
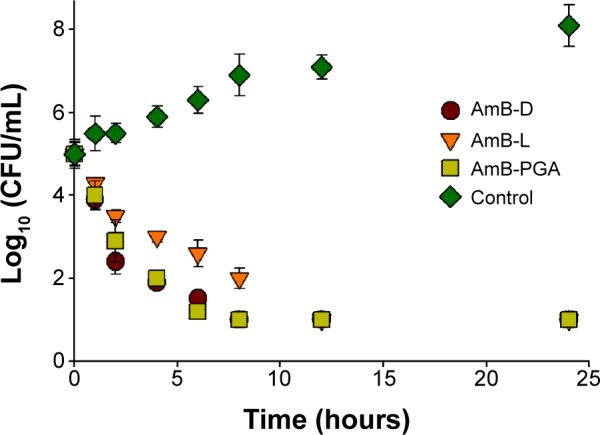
Representative time-kill curve plot for Candida albicans in the presence of AmB-D, AmB-L, or AmB–PGA at 4× minimum inhibitory concentration.
Notes: Wells containing no antibiotic were taken as the control. Assays were performed in quadruplicate. Each result is representative of at least three separate experiments. All values are shown as the mean ± standard deviation.
Abbreviations: AmB, amphotericin B; AmB-D, Fungizone®; AmB-L, Ambisome®; CFU, colony forming units; PGA, polyglutamic acid.