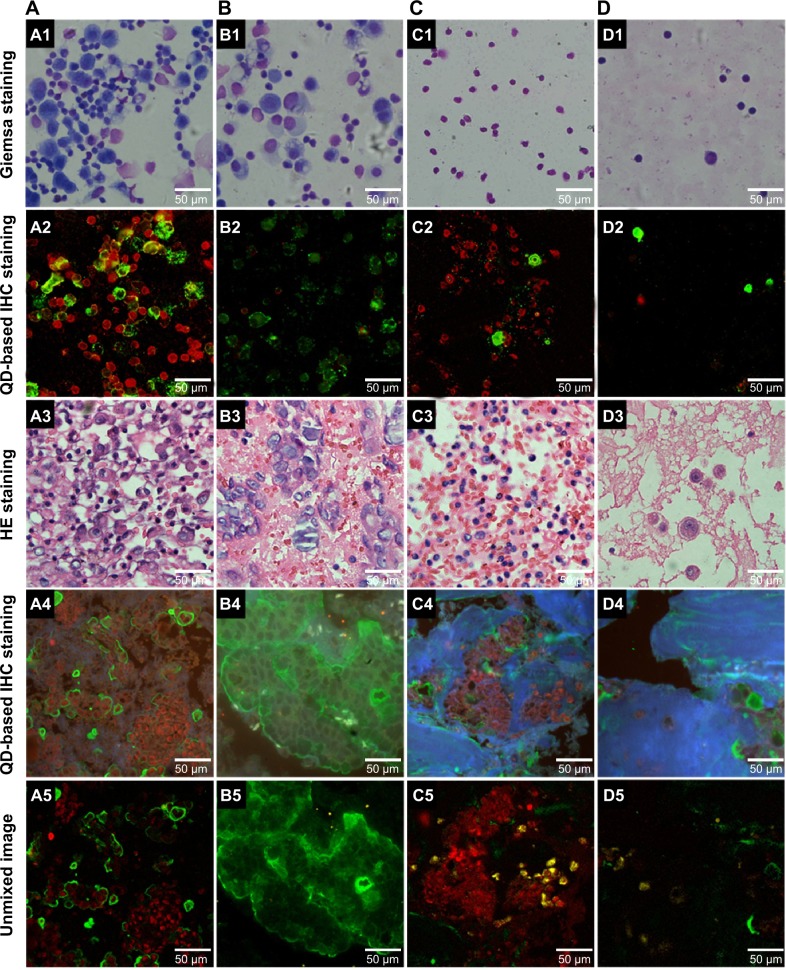
Figure 4.
Relationship between cancer cells and immunocytes in MA.
Notes: Quantitative evaluation between cancer cells and immunocytes in MA. The QD-based multiplexed imaging stained cancer cells green, macrophages yellow, and lymphocytes red. Numerous cancer cells and immunocytes in the slide (A1–A5); many cancer cells and few immunocytes in the slide (B1–B5); few cancer cells and many immunocytes in the slide (C1–C5); and few cancer cells and few immunocytes in the slide (D1–D5). Giemsa staining of MA cell spears (A1–D1); QD-based IHC staining of MA cell spears (A2–D2); HE staining paraffin embedded sections of MA cells (A3–D3); QDs-based IHC staining of paraffin embedded sections of MA cells (A4–D4); unmixed image of (A4–D4) (A5–D5). Scale bar: 50 μm for (A1–D5). Magnifications: 200× for all images (A1–D5).
Abbreviations: MA, malignant ascites; QD, quantum dot; IHC, immunohistochemistry; HE, Haematoxylin and Eosin.

