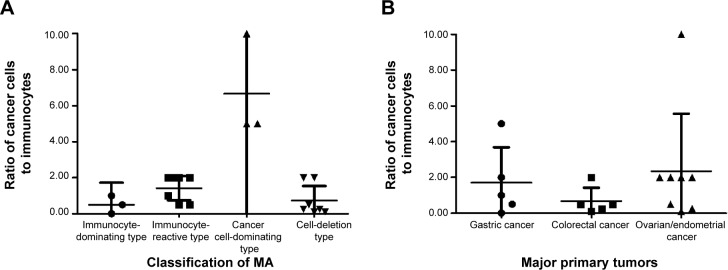
Figure 5.

Scatter diagram of ratios of cancer cells to immunocytes for MA.
Notes: The scatter diagram of the ratios of the four subtypes of MA (A) and the scatter diagram of the ratios of MA from different major primary tumors (B). •, ■, ▲, ▼ means the ratio of cancer cells to immunocytes of each patient with MA. Longer line means the mean ratio of each type, and shorter line means the 95% confidence interval.
Abbreviation: MA, malignant ascites.
