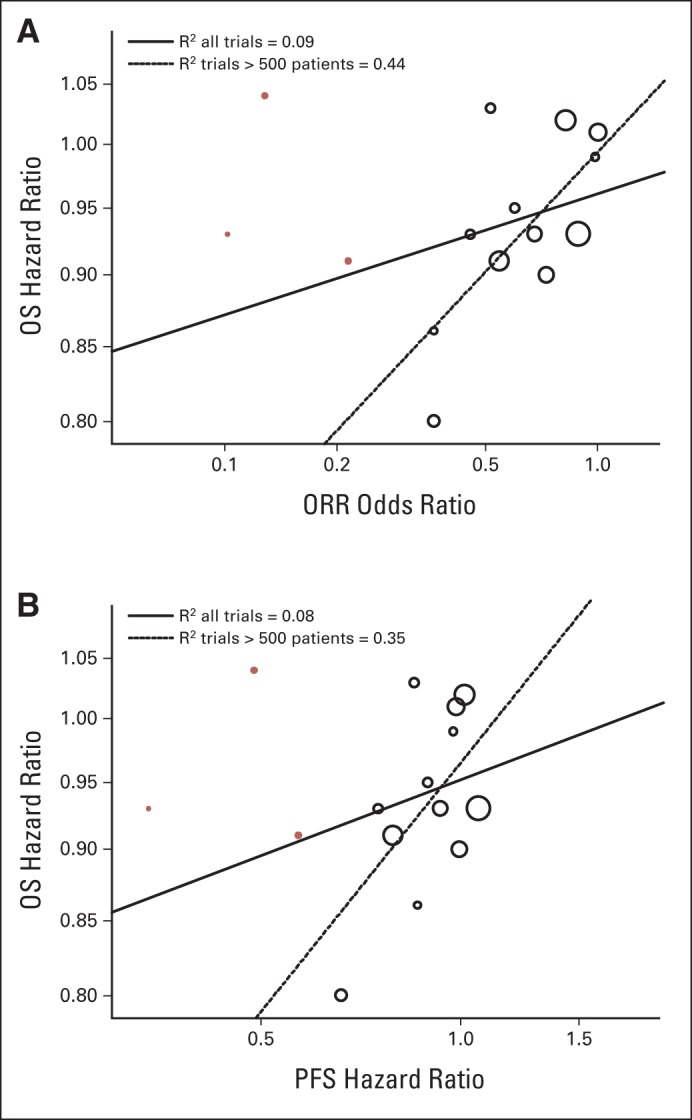
Fig 3.

(A) Scatter plot of trial-level association between treatment effects on overall survival (OS) and overall response rate (ORR). (B) Scatter plot of trial-level association between treatment effects on OS and progression-free survival (PFS). Trials with targeted treatments in molecularly enriched populations (n ≤ 500 patients per trial) are represented by red circles.
