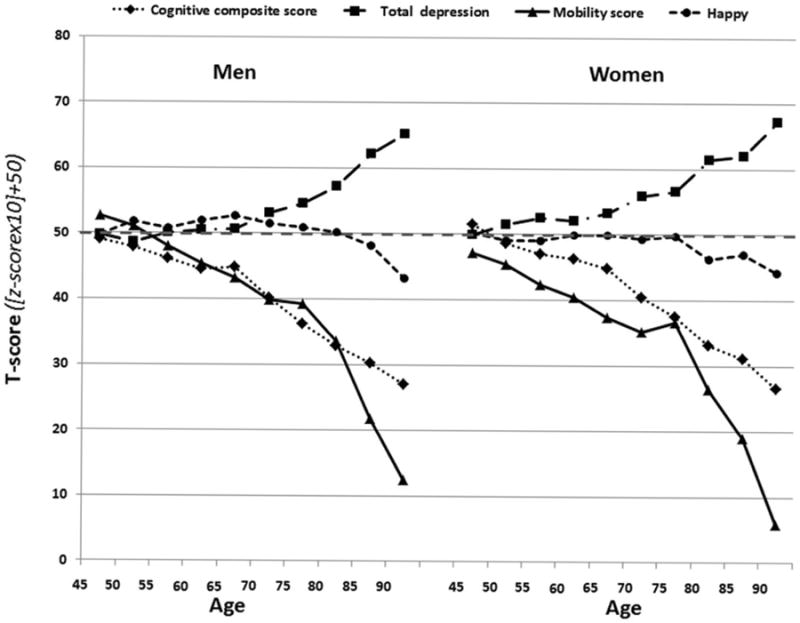
Figure 3.

Age-related differences in the scores of physical and mental functions and the feeling of happiness by gender. Mean of each age group by 5-year intervals ranging from 45–49 to 90+ are plotted against T-scores for each measure. T-scores are scaled to have a mean of 50 and a standard deviation of 10.
