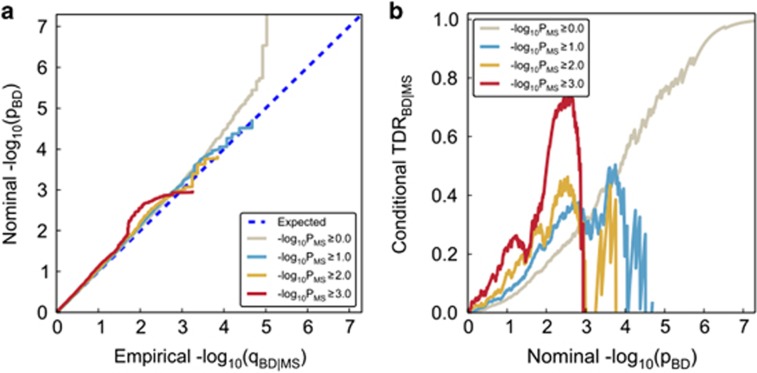
Figure 2.
Genetic pleiotropy enrichment of BD conditional on MS. (a) Conditional Q-Q plot of nominal versus empirical −log10 P-values (corrected for inflation) in bipolar disorder (BD) below the standard GWAS threshold of P<5 × 10⁻⁸ as a function of significance of association with multiple sclerosis (MS) at the level of −log10(P)⩾0, −log10(P)⩾1, −log10(P)⩾2, −log10(P)⩾3 corresponding to P⩽1, P⩽0.1, P⩽0.01, P⩽0.001, respectively. Dotted lines indicate the null hypothesis. (b) Conditional true discovery rate (TDR) plots illustrating the increase in TDR associated with increased pleiotropic enrichment in BD conditioned on MS (BD|MS).

