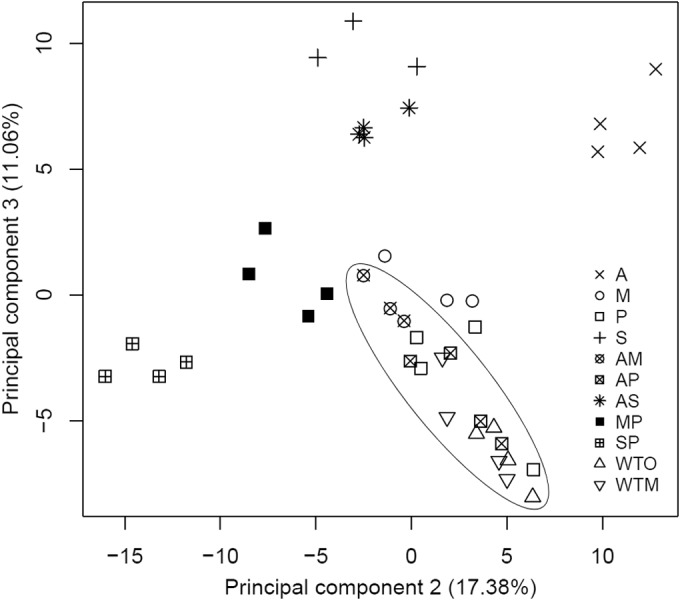
FIG 2.

Principal component analysis distinguishes single-R and CTR L. donovani promastigote lines. This analysis was based on the quantitative measurements of all 257 putatively identified compounds. In this study, three biological replicates were removed due to signal intensity drift: M_BR1, S_BR2, and AM_BR3. Separate PCA plots for each CTR and their respective single-R lines can be found in Fig. S2 in the supplemental material.
