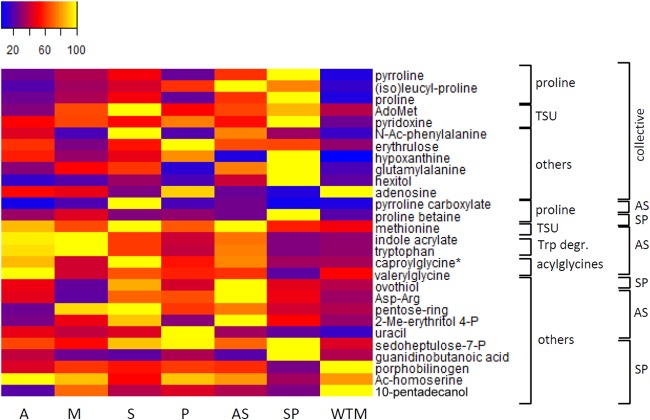
FIG 3.
Metabolic profiles of differential metabolites belonging to the proline biosynthesis pathway, transsulfuration pathway (TSU), tryptophan degradation (Trp degr.), acylglycines, and others in heatmap format. The samples are presented along the bottom. Averages were taken for the intensities of the biological replicates per line, and the intensities were rescaled between 0 (blue) and 100 (yellow). On the right, a first classification is made for the metabolites based on the metabolic pathway to which they belong. A second classification is made based on whether they are shared between the AS and SP line (CTR-collective) or are specific for one CTR line (AS or SP). The asterisk indicates that another isomer was detected for this metabolite (see Table S4 in the supplemental material for more details). AdoMet, S-adenosylmethionine; N-Ac-phenylalanine, N-acetylphenylalanine; 2-Me-erythritol-4-P, 2-methyl-erythritol-4-phosphate; sedoheptulose-7-P, sedopheptulose-7-phosphate. AdoMet was found to be increased significantly in both AS and SP lines but not by 2-fold in AS (fold change, 1.78). Tryptophan (Trp) was found to be increased by 2.58-fold in the AS line, with a P value of 0.0146 but with P > q.

