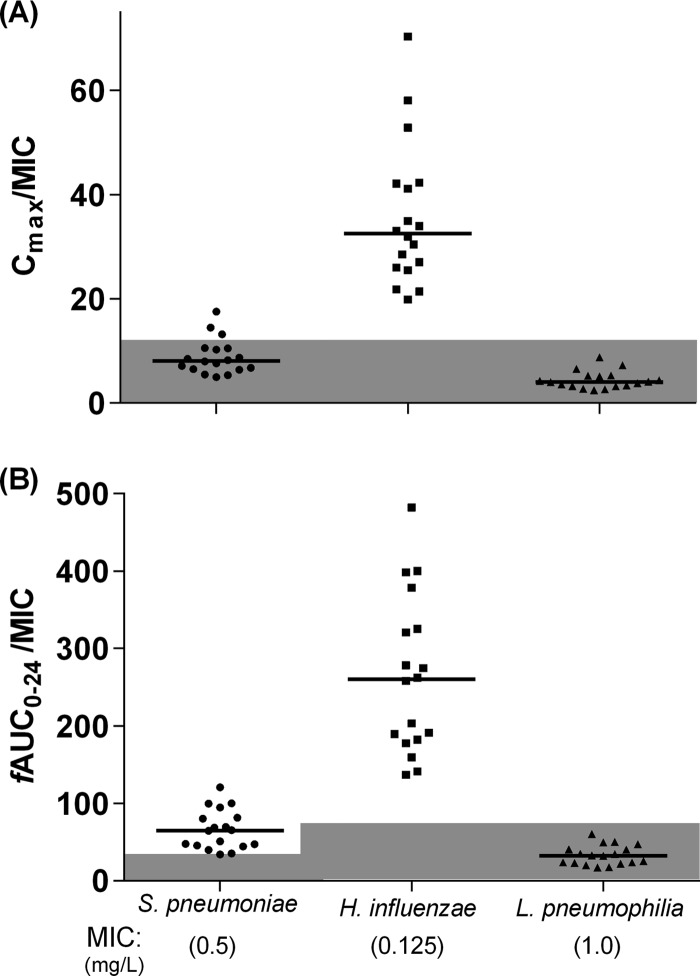
FIG 2.
Model predicted Cmax and fAUC0–24 for each patient compared to the MIC for common respiratory pathogens. Each patient's model-predicted Cmax (A) and fAUC0–24 (B) were divided by the MIC for the indicated pathogen. Values below the PK-PD targets are shaded in gray. PD targets: Cmax/MIC > 12.2 (A); fAUC24/MIC > 34 for S. pneumoniae, fAUC24/MIC > 75 for H. influenzae and L. pneumophila (B). Horizontal lines represent median values.

