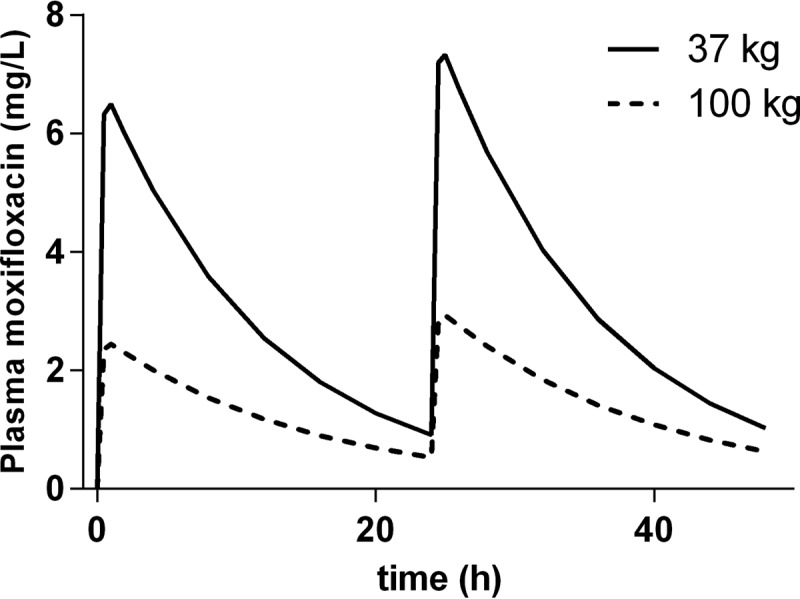
FIG 3.

Illustrations of typical PK profiles of moxifloxacin at 400 mg q.d. in a patient weighing 37 and in a patient weighing 100 kg. Each profile is derived from the PK model presented in Fig. 1 and illustrates the differences in plasma concentrations versus time at the minimum and maximum value of body weight in the current population. The free plasma concentration measured was transformed to the total plasma concentration, assuming a protein binding rate of 40%.
