
FIG 2.
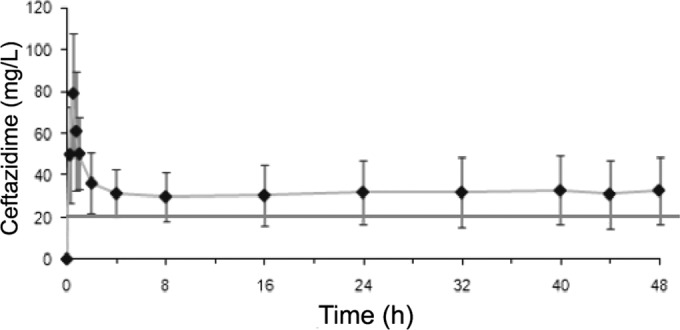
Course of serum concentrations of ceftazidime over time with continuous perfusion. Each point represents the mean ± standard deviation for each blood sample. The curve represents the mean of the computer-assisted modeling.
Official websites use .gov
A
.gov website belongs to an official
government organization in the United States.
Secure .gov websites use HTTPS
A lock (
) or https:// means you've safely
connected to the .gov website. Share sensitive
information only on official, secure websites.
Course of serum concentrations of ceftazidime over time with continuous perfusion. Each point represents the mean ± standard deviation for each blood sample. The curve represents the mean of the computer-assisted modeling.