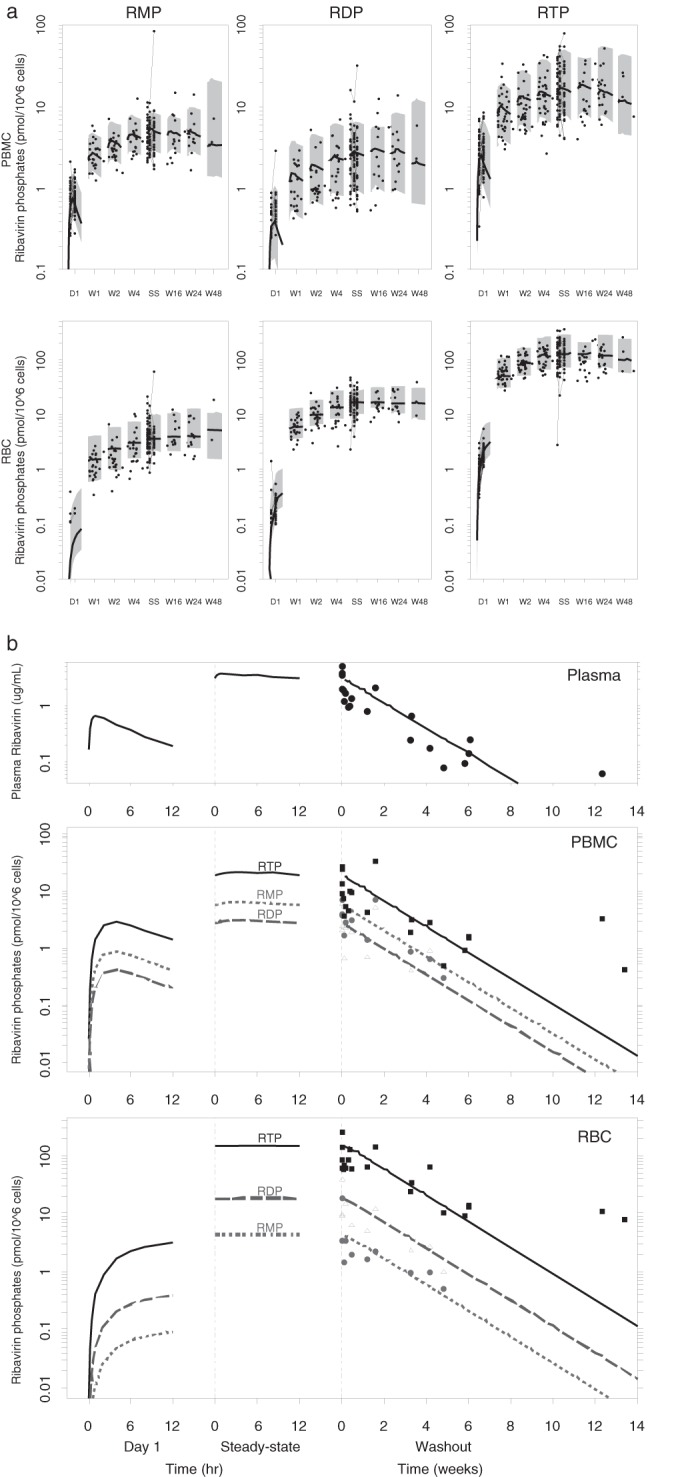
FIG 3.

(a) Observed intracellular data overlaid with the medians (solid lines) and 90% prediction intervals (gray-shaded area) for RMP (left), RDP (middle), and RTP (right) concentration-time profiles in PBMCs (top panels) and RBCs (bottom panels). Gray circles represent the data observed within 12 h postdose at different visits. D1: day 1. W1: week 1. W2: week 2. W4: week 4. SS: steady state (weeks 9 to 13). W16: week 16. W24: week 24. W48: week 48. (b) Simulation of ribavirin plasma and intracellular concentrations after a single dose, at the steady state, and during washout, based on the typical population parameter values. Data points represent the concentrations observed after the last administered ribavirin dose (solid circles = RMP, open triangles = RDP, solid squares = RTP).
