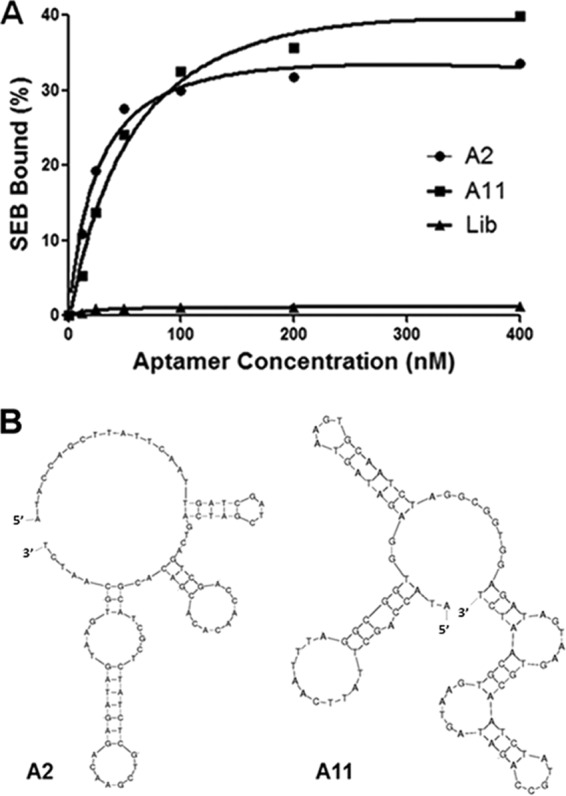
FIG 3.

Dissociation constants and predicted structure of A2 and A11. (A) Binding curve of the aptamers A2 and A11 with SEB. The dissociation constants (Kd) were calculated by nonlinear regression analysis. (B) Comparison of a secondary structure prediction for the aptamers A2 and A22. Structures were predicted by Mfold.
