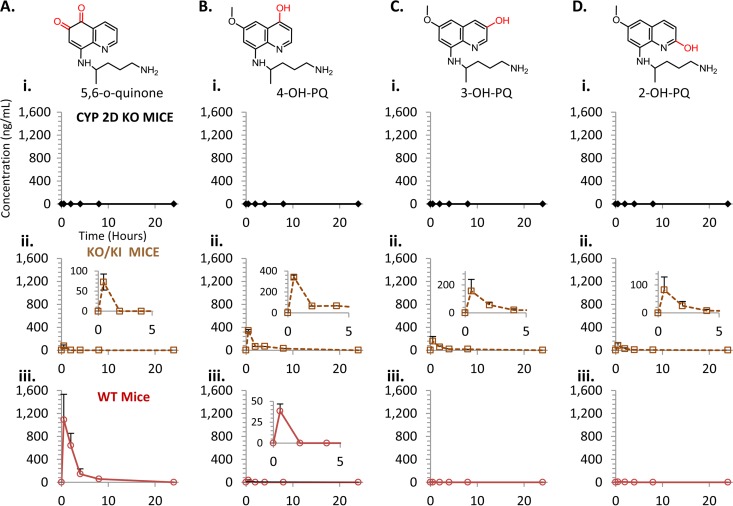
FIG 4.
Plasma pharmacokinetic profiles of primaquine phenolic metabolites. (A) Pharmacokinetics of the 5,6-ortho-quinone of PQ in plasma from the various mouse strains tested. CYP 2D KO mice results are shown in panel i (diamonds, solid line), CYP 2D KO/2D6 KI mice are shown in panel ii (open squares, dashed line), and WT mice are shown in panel iii (open circles, solid line). (B) Pharmacokinetics of the 4-hydroxy-PQ in plasma. (C) Pharmacokinetics of the 3-hydroxy-PQ in plasma. (D) Pharmacokinetics of the 2-hydroxy-PQ in plasma. The various groups shown are the same as indicated above. Concentrations shown are in ng/ml. Insets are provided to magnify the metabolites present at lower levels. The error shown for each measurement is the standard deviation from triplicate analyses. Three animals were utilized for each time point.

