
Figure 2.
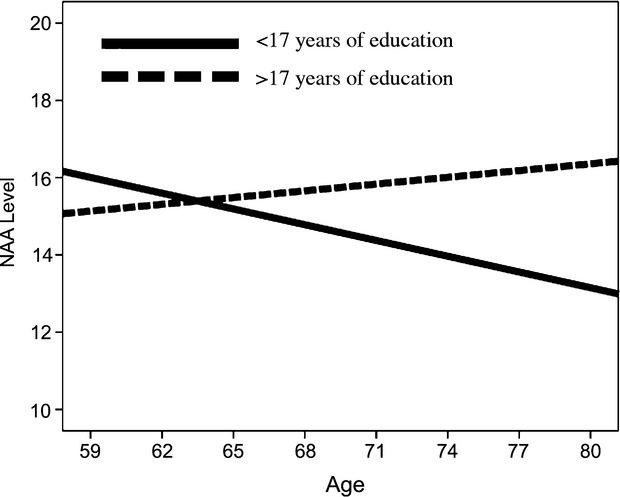
For graphical purposes, the sample was divided into groups, fewer years of education (<17 years; solid line) and higher amounts of education (>17 years; dotted line), based on the Johnson–Neyman calculated threshold of significance. The figure shows that older age is associated with lower NAA levels, but only in the lower education group. This effect was significant after controlling for sex, fitness level, Cr, and income.