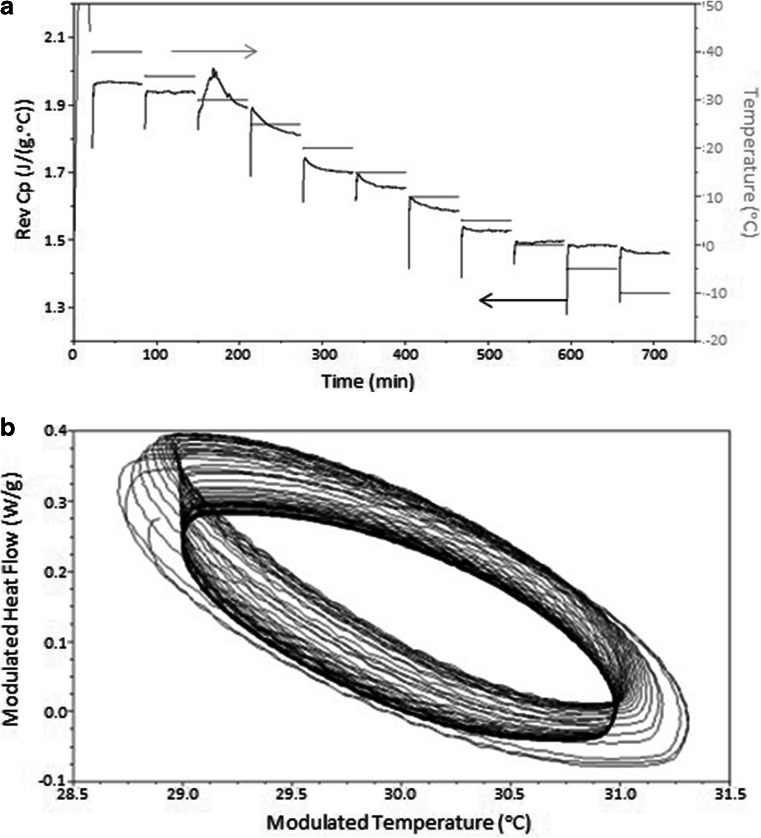
Fig. 4.
(a) Reversing heat capacity versus time signal for Gelucire 44/14 QiMTDSC 60 min isotherm on cooling with 5°C increments (Arrows indicate the scale corresponding to the two data sets). (b) Lissajous plot (modulated heat flow against modulated temperature) of the sine wave heat flow modulations at 30°C. The process begins with the less dense ellipses and terminates in the dense region, indicating equilibration.

