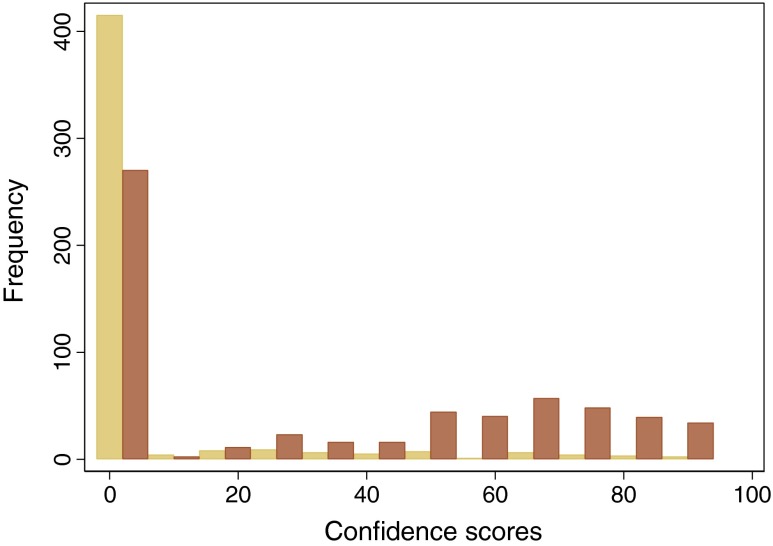
Fig. 4.
Histogram of confidence ratings ascribed by ten radiologists in a prior study of CT colonography [17]. The dark brown bars represent ratings for 107 patients (of whom 60 had colon polyps) when using computer-assisted detection (CAD) whereas the light brown bars represent ratings when unassisted. The distribution is bimodal: The highest peak occurs for patients who received zero scores both with and without CAD. There is a second broader, more continuous distribution for patients, with most scores being 50 or more and a peak at approximately 70

