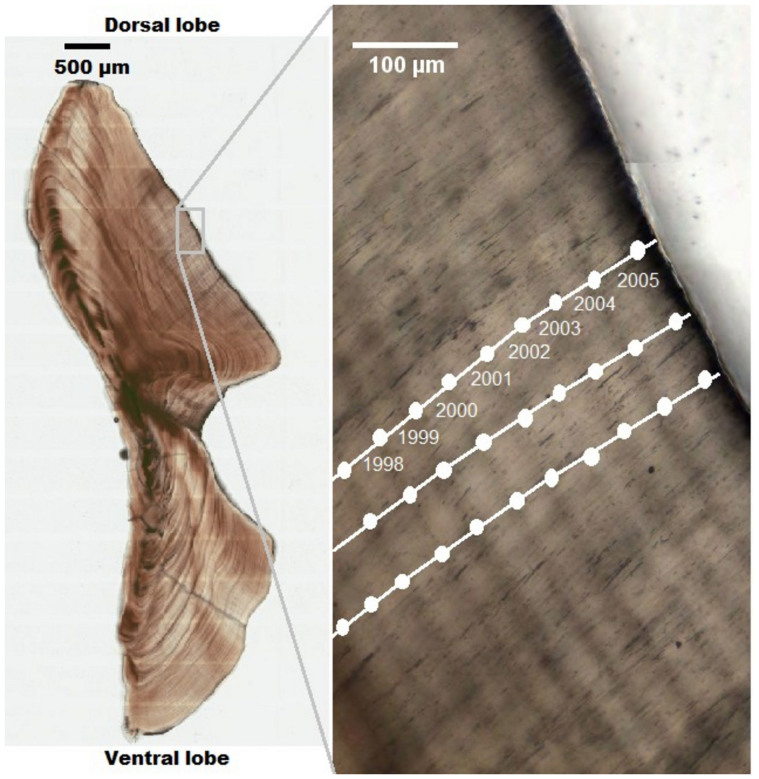
Figure 4. Transmitted light image of a sectioned otolith from a 32-year-old hapuku.
The magnified section shows the dorsal mid-lobe region where opaque zones were marked (white circles) and increments were measured along three transects (white lines). Numbers identify the year in which the increments were formed.

