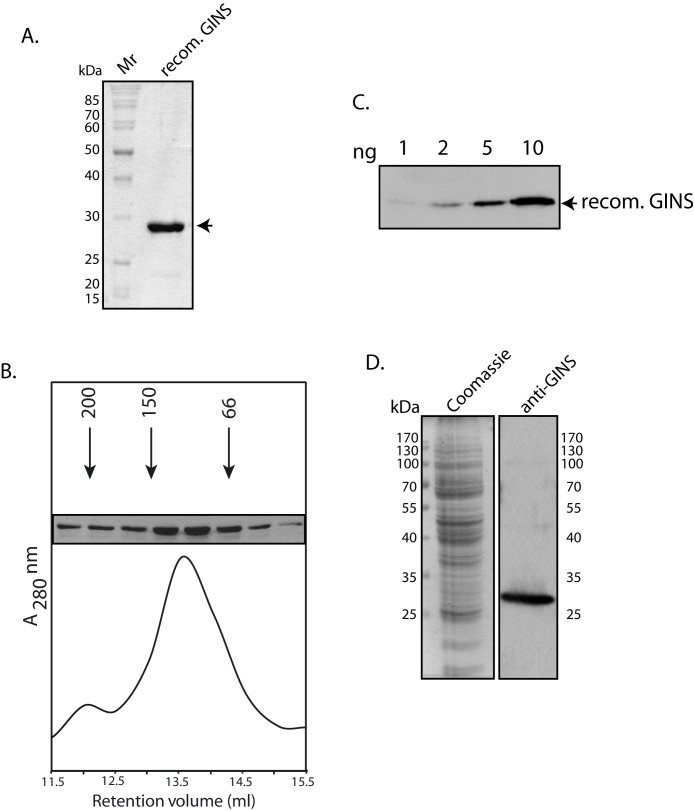
Figure 3.
(A). SDS-PAGE (10% PAGE) analysis of recombinant GINS – Coomassie stain. Mr – molecular weight markers. Arrowhead indicates PtGINS. (B). Gel filtration analysis of PtGINS. Numbers with arrowheads indicate molecular weights and retention volumes of protein calibration markers. SDS-PAGE analysis of fractions matching the retention volumes are shown (full-length gel can be seen on-line in Supplementary Fig. S3A). (C). Western blot analysis of recombinant GINS protein with mouse anti-GINS antibodies (1:1000 dilution; Full-length blot can be seen on-line in Supplementary Fig. S3B). (D). Western blot analysis of Picrophilus torridus extracts (6.5 × 10⁷ cell equivalents) with anti-GINS antibodies (1:1000 dilution). Coomassie stain shows the input extracts (1.6 × 10⁷ cell equivalents). Input extracts for Coomassie stain and for Western Blot were resolved on the same gel, the gel cut in half, one-half used for Western and other half stained with Coomassie.

