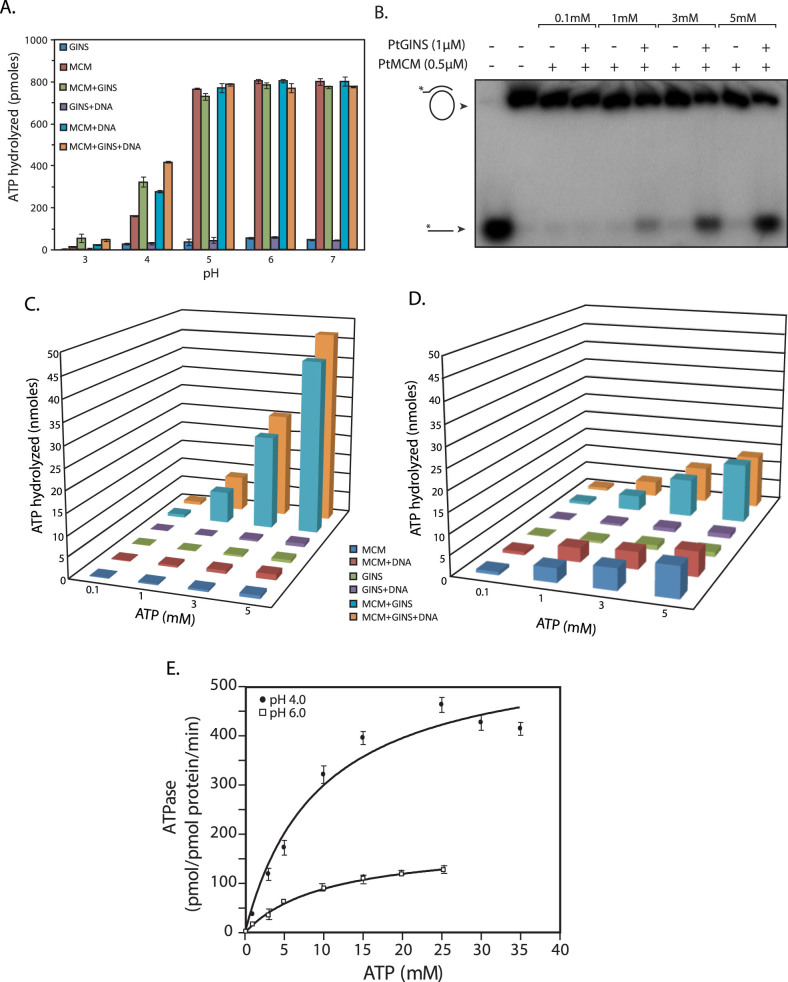
Figure 8.
(A). ATP hydrolysis assay in reactions of different pH carried out in presence or absence of GINS. 500 nM PtMCM and 3000 nM PtGINS were used in reactions containing 100 μM ATP, carried out in presence or absence of DNA for 60 min. (B). Helicase assays carried out using 500 nM PtMCM and 3000 nM PtGINS with varying concentrations of ATP (reaction at pH 4). Lane 1- radiolabelled ssDNA only (loaded as marker); lane 2 – helicase reaction incubated in absence of protein (C). Amount of ATP hydrolyzed during the helicase reactions carried out with varying concentrations of ATP using 500 nM PtMCM and 3000 nM PtGINS (reaction at pH 4 for 60 min). (D). Amount of ATP hydrolyzed during the helicase reactions carried out with varying concentrations of ATP using 500 nM PtMCM and 3000 nM PtGINS (reaction at pH 6 for 60 min). (E). ATP hydrolysis as a function of ATP concentration. 500 nM PtMCM and 3000 nM PtGINS was incubated with 0.1 to 35 mM ATP in the absence of DNA for 25 min. Data presented in (A), (C), (D) and (E) are the mean of three experiments and error bars represent standard deviation.

