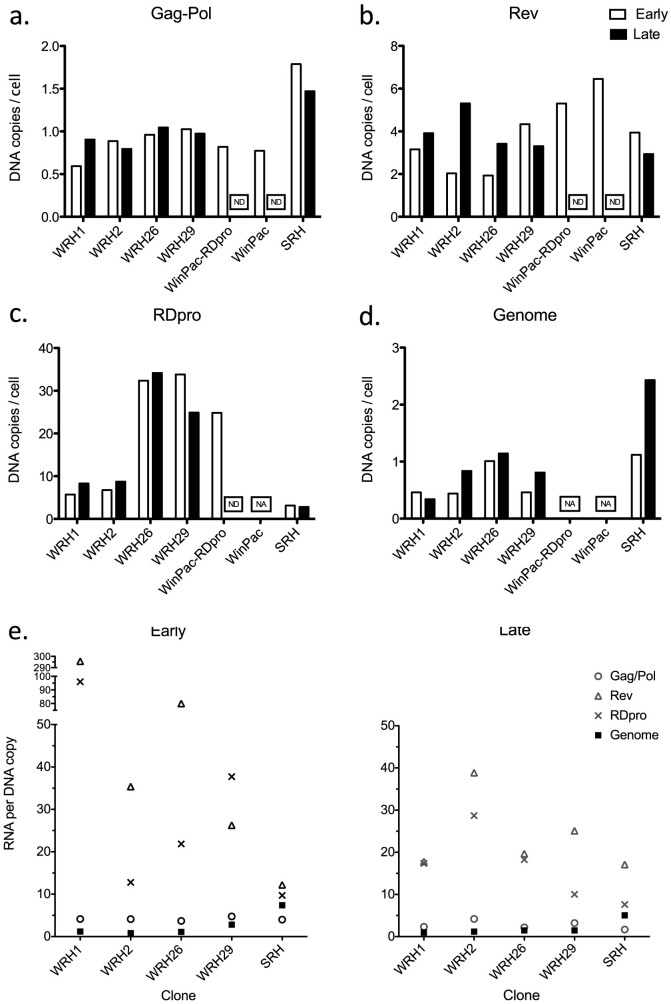
Figure 5. DNA copy numbers and RNA expression levels of each vector component in packaging and producer cell lines.
DNA copy numbers per cell for Gag-Pol (a) Rev (b), RDpro (c) and Genome (d, primers used amplify the HIV-1 leader sequence) measured by qPCR. Cell number per reaction was estimated by performing qPCR for β-actin in parallel. Data shown represents mean of two replicates. (e) RNA expression levels per DNA copy number of each vector component are shown. RNA expression levels were measured by q-RT-PCR and normalized to the β-actin RNA expression levels in each sample and divided by the corresponding DNA copy number. Early (after ≈2–4 weeks in culture) and late (after ≈12–14 weeks in culture) time points were around 8–10 weeks apart.

