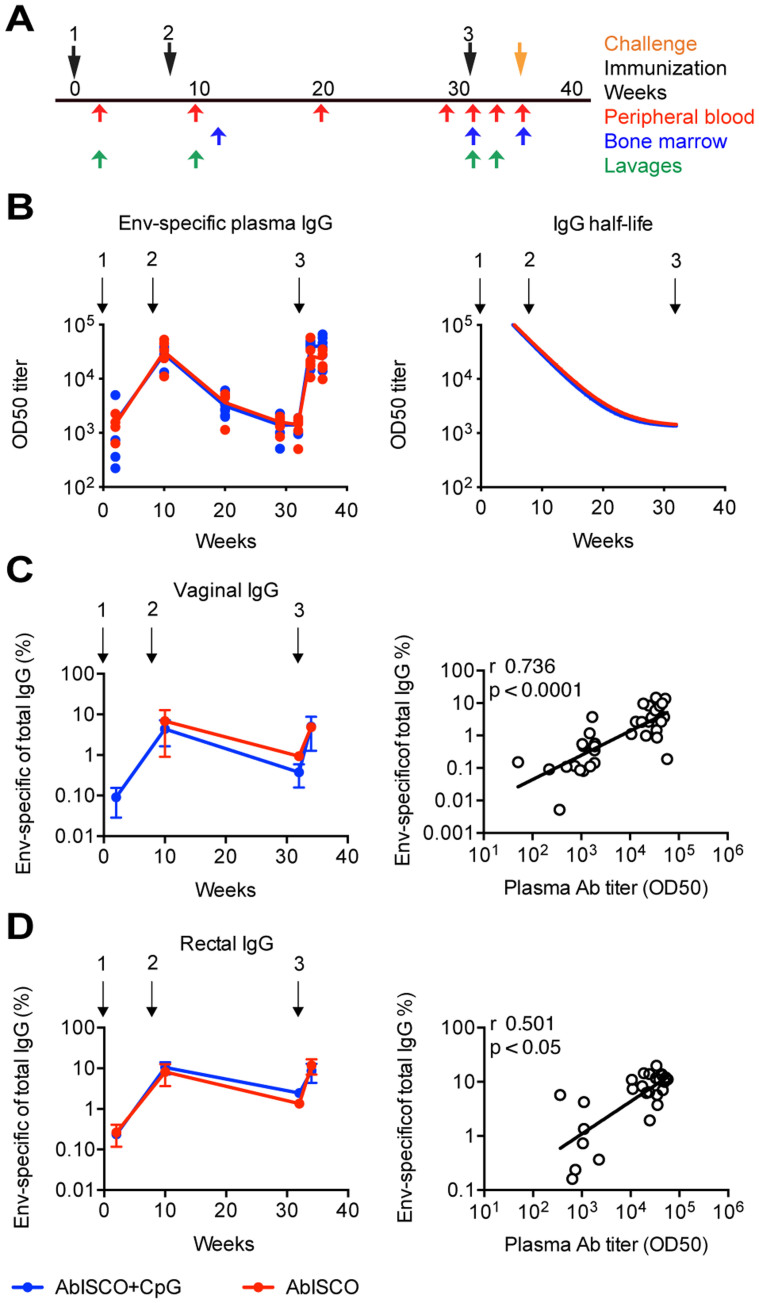
Figure 1. Kinetics of the Env-specific IgG response in periphery and mucosa after immunization.
Animals were divided into three experimental groups as follows: Env formulated in AbISCO-100 (AbISCO) and ODN2395 (AbISCO+CpG) (n = 6), Env formulated in AbISCO (n = 6) and AbISCO and ODN2395 alone (Control) (n = 6). (A) Inoculations were given three times, at weeks 0, 8 and 32 (black arrows). Blood (red arrows), bone marrow (blue arrows), and vaginal and rectal lavage (green arrows) were sampled at the indicated time point. (B) Binding of Env-specific IgG represented as log10 of OD50 titers (left panel), and half-life during the long-term interval (right panel); each dot represent an animal and the lines represent a group, AbISCO+CpG (blue) and AbISCO (red). There was no difference in the Env-specific plasma antibody titers at any time point, as assessed by two-way ANOVA followed by Bonferroni multiple comparison post-test. (C, D) Mucosal responses presented as % Env-specific IgG of total IgG in the sample, were evaluated for vaginal (C) and rectal (D) lavages at four different time points (left panels) with error bars representing the standard error of the mean; AbISCO+CpG (blue) and AbISCO (red). Positive correlations between the mucosa Ab frequencies and the circulating Ab titers was found through non-parametric Spearman (r); linear regression indicates a good fit (right panels).

