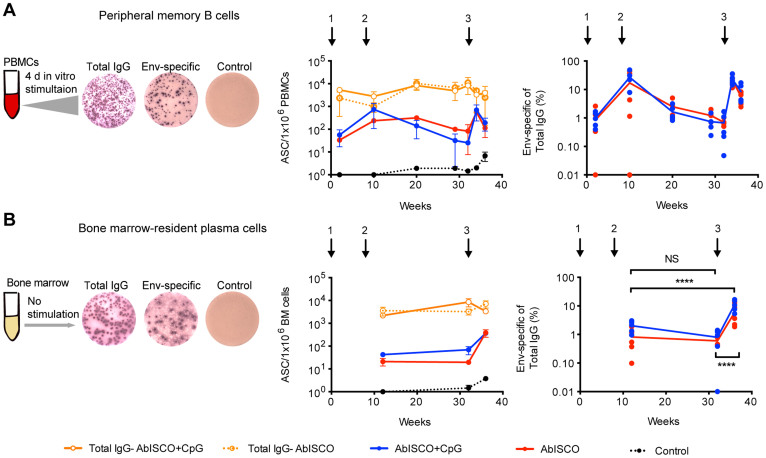
Figure 2. Env-specific ASC frequency in the periphery and in the bone marrow.
A and B left diagrams show the experimental setup for the analysis of peripheral memory B cells (A) and bone marrow-resident plasma cells (B). Memory B cell analysis requires in vitro mitogenic activation for differentiation into ASC, contrary to plasma cells that spontaneously secrete Ab and already defined as ASC. Kinetics of the response plotted as ASC per 1 × 10⁶ cells (middle panels) and frequency of cells producing Env-specific IgG in relation to total IgG (right panels). Circles indicate group mean (n = 6). Quantification of the cells against: total IgG in the AbISCO group (orange circle, dotted line) and AbISCO+CpG group (orange circle, solid line); Env-specific in the AbISCO group (red) and AbISCO+CpG group (blue); and the negative control, Ovalbumin (black). The same color scheme was used in A and B. Because there was no difference between the AbISCO and AbISCO+CpG groups, these were pooled and responses at the different time points evaluated with Two-way ANOVA followed by Bonferroni's post-test for multiple comparisons. NS = non-significant. ****p < 0.0001.

