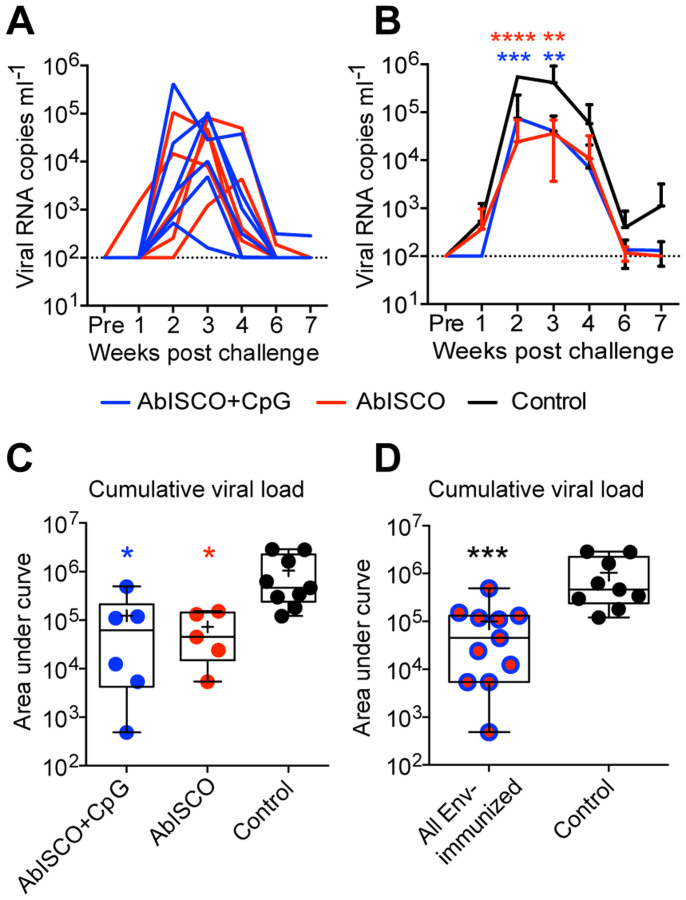
Figure 6. Evaluation of SHIV-SF61P4 viral load in infected macaques.
Viral load (copies per ml) was determined by one-step Q-RT-PCR in plasma sampled weekly, for seven weeks, following vaginal challenge with 100 TCID50 SHIV-SF162P4 viruses. The limit of detection was 100 viral RNA copies per ml plasma. (A) Viral load curves are shown for individual Env-immunized macaques in the AbISCO (red, n = 5) or AbISCO+CpG (blue, n = 6) groups. (B) Group viral load curves are shown (mean ± SD) for AbISCO (red n = 5), AbISCO+CpG (blue, n = 6) and Control (black, n = 9) over a seven week period. Statistical differences were evaluated with Two-way ANOVA followed by Bonferroni's post-test. Red stars indicate AbISCO vs Control (2 w post challenge, p < 0.00001; 3 w post challenge, p = 0.0053) and Blue stars indicate AbISCO+CpG vs Control (2 w post challenge, p = 0.0.0001; 3 w post challenge, p = 0.0032). (C, D) The cumulative viral load over the seven weeks of monitoring was determined by quantifying the area under curve. In (C) the AbISCO (red) and AbISCO+CpG (blue) groups were compared with the Control group and in (D) the pooled AbISCO and AbISCO+CpG groups, referred to as “All Env-immunized” (red/blue circles, n = 11) were compared with the Control group (black, n = 9) using the Kruskal-Wallis test followed by Dunn's post-test (C; p = 0.0321 and p = 0.0155 respectively) and the Mann-Whitney test (D; p = 0.0005). Significant differences were determined as *p < 0.05, **p < 0.01, ***p < 0.001 and ****p < 0.0001. Box plots show median (line), mean (plus), 25–75% (box) and min-max (whiskers). The same color scheme was used throughout the figure.

