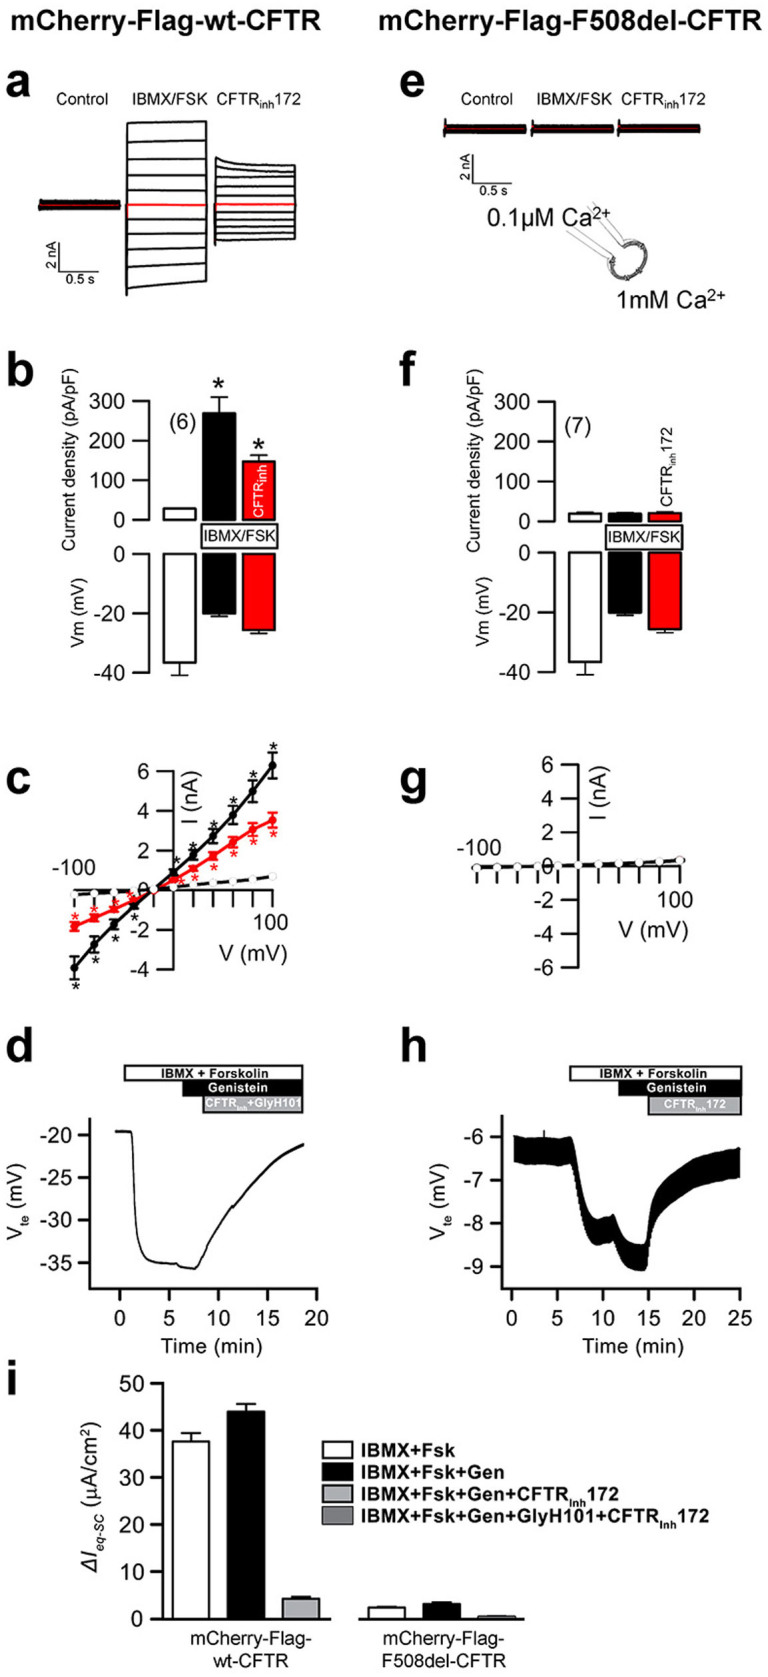
Figure 3. Electrophysiological characterization of the CFBE cell lines.

Characterization of the chloride transport activity of mCherry-Flag-wt-CFTR (a–d, i) and mCherry-Flag-F508del-CFTR (e–i). (a) Overlay currents indicating pronounced wt-CFTR whole cell currents after stimulation with IBMX (100 μM) and forskolin (2 μM), and potent inhibition by CFTRinh172 (10 μM). Summary of current densities and membrane voltages (b) and current/voltage relationships (c). White circles: unstimulated cells; black circles: cells stimulated with IBMX/forskolin; gray circles: stimulated cells after inhibition with CFTRinh172. Mean ± SEM (number of cells). (d) wt-CFTR-dependent transepithelial chloride transport measurement in an Ussing chamber experiment. Chloride secretion was promoted by forskolin and inhibited by a cocktail of CFTRInh172 and GlyH101. (e) Overlay currents indicating lack of current activation of F508del-CFTR. Summary of current densities and membrane voltages (f) and current/voltage relationships (g). Mean ± SEM (number of cells). *significant activation by IBMX/forskolin and inhibition by CFTRinh172 (paired t-test). (h) F508del-CFTR-dependent transepithelial chloride transport measurement in an Ussing chamber experiment. (i) Summary of wt- and F508del-CFTR-dependent equivalent short circuit currents as derived from Ussing chamber measurements.
