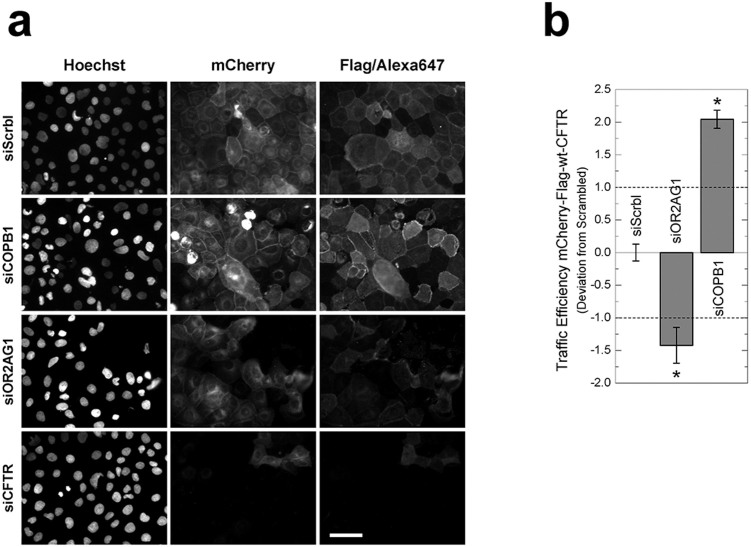
Figure 5. Example widefield epifluorescence microscopy images obtained from the CFTR traffic assay.
CFBE cells expressing the mCherry-Flag-wt-CFTR construct were treated with distinct siRNAs (see methods) and Flag-tags stained (a). As a negative control, cells were treated with a non-targeting siRNA (Scrambled/siScrbl). Treatment with a siRNA targeting CFTR itself (siCFTR) highlights the specific detection of CFTR and the high transfection efficiency. Traffic of mCherry-Flag-wt-CFTR was significantly enhanced by knocking down COPB1 (siCOPB1) and significantly decreased by knocking down OR2AG1 (siOR2AG1). Scale bar = 50 μm. Images were quantified to determine traffic efficiency (Formula 1, see methods) (b). Data is presented as the median deviation to negative controls ± SEM (Formula 2). Horizontal dashed lines represent the threshold defined in Formula 2. * p < 0.01 (t-test).

